Overview of the Maternal and Child Health (MCH) Dashboard
- The Maternal, Woman and Child Health (MCH) 2020 dashboard is comprised of National and State selected performance measures to support the assessment of needs and to monitor progress towards improving the health of New York State residents and reducing health disparities, specifically for the following populations: women, infants, children and adolescents including children and youth with special health care needs. It serves as an interactive visual presentation of the state and county data.
- Maternal and Child Health (MCH) State Dashboard
- The state dashboard homepage provides a quick view of the most currently available data and the 2020 objectives for 43 tracking indicators. On this page, indicators are grouped by priority area and the most current data are compared to the previous data period to assess the annual progress for each indicator. From here, historical (trend) data for the tracking indicators are easily accessed. We have also enhanced the state level dashboard for 34 indicators, with drill-down data and visualizations on major socio-demographic characteristics such as age group, race/ethnicity, sex, region, health insurance status, level of education, etc., where available. These visualizations and data can be accessed from the state dashboard link above.
- Maternal and Child Health (MCH) County Dashboard
- The county dashboard homepage includes the most current data available for 16 tracking indicators, again grouped by priority area. Each county in the state has its own dashboard homepage. County maps and graphs and comparison across counties are available. These visualizations and data can be accessed from the county dashboard link above.
Maternal and Child Health (MCH) Data Export Links
Technical Notes
- Definition of Indicators
-
Maternal and Women's Health
Indicator
Indicator Description and Note
Data Source
1 - Percentage of women aged 18-44 years with a preventive medical visit in the past year
The number of women, aged 18 through 44 years, who had a routine preventive medical visit in the past year per 100 women aged 18 through 44 years.
Estimates for the state total on the state level dashboard are provided by the Health Resources and Services Administration, a federal agency, and may be different from state totals on county dashboards that are generated by the NYS specific data sources.
Note: The definition changed in 2018 and is not comparable to previous survey years; thus, only data from 2018 and onward are shown.
Behavioral Risk Factor Surveillance System (CDC)1
2 - Percentage of women aged 18-44 years who report ever talking with a health care provider about ways to prepare for a healthy pregnancy
County Dashboard Number - 1
The number of women, aged 18 through 44 years, who talked with a health care provider about ways to prepare for a healthy pregnancy per 100 women aged 18 through 44 years.
Behavioral Risk Factor Surveillance System (NYS)2
3 - Percentage of women who had a dental visit for teeth cleaning during pregnancy
The number of women who had a preventive dental visit for teeth cleaning during pregnancy per 100 women who had a live birth.
Pregnancy Risk Assessment Monitoring System (NYS)3
4 - Percentage of births with early (1st trimester) prenatal care
County Dashboard Number - 2
The number of births (excluding births without a known prenatal care start date) that began prenatal care within the first three months of pregnancy (1st trimester) per 100 live births.
Estimates for the state total on the state level dashboard are provided by the Health Resources and Services Administration, a federal agency, and may be different from state totals on county dashboards that are generated by the NYS specific data sources.
State: National Vital Statistics System4
County: NYS Vital Statistics Event Registry5
5 - Rate of severe maternal morbidity per 10,000 delivery hospitalizations
The number of delivery hospitalizations that meet the CDC-developed definition of severe maternal morbidity identified from hospital discharge procedures and diagnosis codes that indicate a potentially life-threatening condition or maternal complication (Callaghan et al, 2012) per 10,000 delivery hospitalizations. Delivery hospitalizations were identified by diagnosis codes for an outcome of delivery, diagnosis-related group delivery codes, and procedure codes for selected delivery-related procedures (Kuklina et al, 2008). State-level estimates include inpatient stays for state residents treated in their home state and state residents treated in other states that provide data to the Healthcare Cost and Utilization Project (HCUP).
Estimates on the state level dashboard are provided by the Health Resources and Services Administration, a federal agency, and may be different from results that are generated by the NYS specific data sources.
Note: Data for 2016 and onward are based on ICD-10-CM/PCS and may not be comparable to previous ICD-9-CM estimates; thus, only data from 2016 and onward are shown. This measure was also revised to exclude blood transfusions, leading to a revision of the MCH 2020 objective and baseline year.
Callaghan WM, Creanga AA, Kuklina EV. Severe maternal morbidity among delivery and postpartum hospitalizations in the United States. Obstet Gynecol. 2012 Nov;120(5):1029-36.
Kuklina EV, Whiteman MK, Hillis SD, Jamieson DJ, Meikle SF, Posner SF, et al. An enhanced method for identifying obstetric deliveries: implications for estimating maternal morbidity. Matern Child Health J 2008;12:469-77.
Healthcare Cost and Utilization Project-State Inpatient Database (HCUP-SID)6
6 - Maternal mortality rate per 100,000 live births
County Dashboard Number - 3
The number of deaths related to or aggravated by pregnancy and occurring within 42 days of the end of pregnancy (defined as death records with causes of death ICD-10: A34, O00-O95, O98-O99) per 100,000 live births.
Estimates on the state level dashboard are provided by the Health Resources and Services Administration, a federal agency, and may be different from results that are generated by the NYS specific data sources.
Note: Beginning with 2014 data at the state level, there was an improvement in data validation using women's age and pregnancy status. Data prior to 2014 are not comparable; thus, only time periods starting with 2014 and onward are shown.
State: National Vital Statistics System4
County: NYS Vital Statistics Event Registry5
7 - Newborns with neonatal withdrawal symptoms and/or affected by maternal use of drugs of addiction (any diagnosis), crude rate per 1,000 newborn discharges
County Dashboard Number - 4
Neonatal withdrawal symptoms from maternal use of drugs of addiction, and/or newborns affected by maternal use of drugs of addiction (other than cocaine). ICD-10-CM: Principal Diagnosis: Z38 (liveborn infants) AND P96.1 (neonatal withdrawal symptoms from maternal use of drugs of addiction) or P04.49 (newborns affected by maternal use of drugs of addiction (other than cocaine)) or P04.14 (newborns affected by maternal use of opiates) or P04.17 (newborns affected by maternal use of sedative-hypnotics) or P04.1A (newborns affected by maternal use of anxiolytics) in any other diagnoses. P04.14, P04.17, and P04.1A are three new codes effect 10/1/2018.
Note: Data for 2016 and onward are based on ICD-10-CM and may not be comparable to previous ICD-9-CM estimates; thus, only data from 2016 and onward are shown. Estimates on the state level dashboard were previously taken from the Health Resources and Services Administration's Federally Available Data (FAD) Resource Document, but now come from the NYS SPARCS database using a revised definition. Direct comparisons between the two data sources are not recommended.
State: Statewide Planning and Research Cooperative System (SPARCS)7
County: Statewide Planning and Research Cooperative System (SPARCS)7
8 - Percentage of non-medically indicated early elective deliveries
The number of inductions or cesareans without labor or spontaneous rupture of membranes among deliveries at 37, 38 weeks' gestation without conditions possibly justifying elective delivery <39 weeks per 100 deliveries at 37, 38 weeks' gestation without conditions possibly justifying elective delivery <39 weeks. Indicator data reflect all births in Medicare-certified hospitals (virtually all US hospitals excluding critical access and VHA hospitals).
Estimates for the state total on the state level dashboard are provided by the Health Resources and Services Administration, a federal agency, and may be different from state totals on county dashboards that are generated by the NYS specific data sources.
CMS Hospital Compare8
Perinatal and Infant Health
Indicator
Indicator Description and Note
Data Source
9 - Infant mortality rate per 1,000 live births
County Dashboard Number - 5
The number of infant deaths up to 364 days of age per 1,000 live births.
Estimates for the state total on the state level dashboard are provided by the Health Resources and Services Administration, a federal agency, and may be different from state totals on county dashboards that are generated by the NYS specific data sources.
State: National Vital Statistics System4
County: NYS Vital Statistics Event Registry5
10 - Neonatal mortality rate per 1,000 live births
County Dashboard Number - 6
The number of infant deaths under 28 days of age per 1,000 live births.
Estimates for the state total on the state level dashboard are provided by the Health Resources and Services Administration, a federal agency, and may be different from state totals on county dashboards that are generated by the NYS specific data sources.
State: National Vital Statistics System4
County: NYS Vital Statistics Event Registry5
11 - Post-neonatal mortality rate per 1,000 live births
County Dashboard Number - 7
The number of infant deaths from 28 to 364 days of age per 1,000 live births.
Estimates for the state total on the state level dashboard are provided by the Health Resources and Services Administration, a federal agency, and may be different from state totals on county dashboards that are generated by the NYS specific data sources.
State: National Vital Statistics System4
County: NYS Vital Statistics Event Registry5
12 - Perinatal mortality rate per 1,000 live births plus fetal deaths
County Dashboard Number - 8
Perinatal mortality rate is defined as the number of infant deaths under 7 days of age and fetal deaths at 28 weeks or more of gestation per 1,000 live births plus fetal deaths at 28 weeks or more of gestation.
Estimates for the state total on the state level dashboard are provided by the Health Resources and Services Administration, a federal agency, and may be different from state totals on county dashboards that are generated by the NYS specific data sources.
State: National Vital Statistics System4
County: NYS Vital Statistics Event Registry5
13 - Sudden Unexpected Infant Death (SUID) rate per 1,000 live births
The number of SUIDs per 1,000 live births.
Estimates on the state level dashboard are provided by the Health Resources and Services Administration, a federal agency, and may be different from results that are generated by the NYS specific data sources.
National Vital Statistics System4
14 - Percentage of infants placed to sleep on their backs
The number of mothers reporting that they most often place their baby to sleep on their back only, per 100 women who had a live birth. Excluding those whose babies have died or are not living with them.
Pregnancy Risk Assessment Monitoring System (NYS)3
15 - Preterm-related mortality rate per 100,000 live births
The number of deaths due to preterm-related causes among the number of live births per 100,000. Causes are defined as preterm-related if 75% or more of infants whose deaths were attributed to that cause were born at less than 37 weeks of gestation, and the cause of death was a direct consequence of preterm birth. This includes low birth weight, several maternal complications, respiratory distress, bacterial sepsis, etc. To be included as a preterm-related death, the infant must have been born preterm (<37 completed weeks of gestation) with the underlying cause of death assigned to one of the following ICD-10 categories: K550, P000, P010, P011, P015, P020, P021, P027, P070-P073, P102, P220-229, P250-279, P280, P281, P360-369, P520-523, and P77.
Estimates for the state total on the state level dashboard are provided by the Health Resources and Services Administration, a federal agency, and may be different from state totals on county dashboards that are generated by the NYS specific data sources.
National Vital Statistics System4
16 - Percentage of preterm births (less than 37 weeks gestation)
County Dashboard Number - 9
The number of infants born at less than 37 weeks clinically estimated gestation per 100 live births with known gestational age.
State: NYS Vital Statistics Event Registry5
County: NYS Vital Statistics Event Registry5
17 - Percentage of very low birth weight (VLBW) infants born in a hospital with a Level III+ Neonatal Intensive Care Unit (NICU)
The number of VLBW infants born in a hospital with a level III or higher NICU per 100 VLBW infants (< 1500 grams).
NYS Vital Statistics Event Registry5
18 - Newborns with neonatal withdrawal symptoms and/or affected by maternal use of drugs of addiction (any diagnosis), crude rate per 1,000 newborn discharges
County Dashboard Number - 10
Neonatal withdrawal symptoms from maternal use of drugs of addiction, and/or newborns affected by maternal use of drugs of addiction (other than cocaine). ICD-10-CM: Principal Diagnosis: Z38 (liveborn infants) AND P96.1 (neonatal withdrawal symptoms from maternal use of drugs of addiction) or P04.49 (newborns affected by maternal use of drugs of addiction (other than cocaine)) or P04.14 (newborns affected by maternal use of opiates) or P04.17 (newborns affected by maternal use of sedative-hypnotics) or P04.1A (newborns affected by maternal use of anxiolytics) in any other diagnoses. P04.14, P04.17, and P04.1A are three new codes effect 10/1/2018.
Note: Data for 2016 and onward are based on ICD-10-CM and may not be comparable to previous ICD-9-CM estimates; thus, only data from 2016 and onward are shown. Estimates on the state level dashboard were previously taken from the Health Resources and Services Administration's Federally Available Data (FAD) Resource Document, but now come from the NYS SPARCS database using a revised definition. Direct comparisons between the two data sources are not recommended.
State: Statewide Planning and Research Cooperative System (SPARCS)7
County: Statewide Planning and Research Cooperative System (SPARCS)7
Child Health
Indicator
Indicator Description and Note
Data Source
19 - Percentage of children and adolescents aged 0-17 years who are in excellent or very good health
The number of children and adolescents, aged 0 through 17 years, reported by their parents to be in excellent or very good health per 100 children and adolescents aged 0 through 17 years.
Note: Previous iterations of the dashboard had presented data as single-year estimates. Beginning with the 2022 dashboard update, data will be presented as two-year estimates, in accordance with the Health Resources and Services Administration's Federally Available Data (FAD) Resource Document.
National Survey of Children's Health9
20 - Percentage of children aged 9-35 months who received a developmental screening using a parent-completed screening tool in the past year
The number of children, aged 9 through 35 months, who had a health care visit in the past 12 months and whose parents completed a Standardized Developmental Screening tool in the past 12 months per 100 children, aged 9 through 35 months, who had a health care visit in the past 12 months.
Note: Previous iterations of the dashboard had presented data as single-year estimates. Beginning with the 2022 dashboard update, data will be presented as two-year estimates, in accordance with the Health Resources and Services Administration's Federally Available Data (FAD) Resource Document.
National Survey of Children's Health9
21 - Percentage of children and adolescents aged 3-17 years with a mental/behavioral condition who received treatment or counseling from a mental health professional during the past 12 months
The number of children and adolescents, aged 3 through 17 years, with a mental/behavioral condition who received treatment or counseling from a mental health professional during the past 12 months per 100 children and adolescents, aged 3 through 17 years with a mental/behavioral condition.
Note: Previous iterations of the dashboard had presented data as single-year estimates. Beginning with the 2022 dashboard update, data will be presented as two-year estimates, in accordance with the Health Resources and Services Administration's Federally Available Data (FAD) Resource Document.
National Survey of Children's Health9
22 - Percentage of children and adolescents aged 1-17 years who had one or more preventive dental care visits in the past year
The number of children and adolescents, aged 1 through 17 years, who had a preventive dental visit in the past year per 100 children and adolescents aged 1 through 17 years.
Note: Previous iterations of the dashboard had presented data as single-year estimates. Beginning with the 2022 dashboard update, data will be presented as two-year estimates, in accordance with the Health Resources and Services Administration's Federally Available Data (FAD) Resource Document.
National Survey of Children's Health9
23 - Percentage of NYS residents served by community water systems that have optimally fluoridated water
County Dashboard Number - 11
The number of residents served by community water systems with optimal fluoride levels per 100 residents served by community water systems.
The Safe Drinking Water Information System (SDWIS) contains information about public water systems (PWSs) as reported to EPA by the states. This information is used by regulatory agencies to help track PWS treatment processes, facility data, and compliance with drinking water requirements.
State: Safe Drinking Water Information System (SDWIS)10
County: Safe Drinking Water Information System (SDWIS)10
24 - Percentage of children and adolescents aged 1-17 years who have decayed teeth or cavities in the past 12 months
The number of children and adolescents, aged 1 through 17 years, who have decayed teeth or cavities in the past 12 months per 100 children and adolescents aged 1 through 17 years.
Note: Previous iterations of the dashboard had presented data as single-year estimates. Beginning with the 2022 dashboard update, data will be presented as two-year estimates, in accordance with the Health Resources and Services Administration's Federally Available Data (FAD) Resource Document.
National Survey of Children's Health9
25 - Percentage of children aged 6-11 years who were reported by their parents to be physically active at least 60 minutes per day in the past week
The number of children, aged 6 through 11 years, who were reported by their parents to be physically active at least 60 minutes per day in the past week per 100 children aged 6 through 11 years.
Note: Previous iterations of the dashboard had presented data as single-year estimates. Beginning with the 2022 dashboard update, data will be presented as two-year estimates, in accordance with the Health Resources and Services Administration's Federally Available Data (FAD) Resource Document.
National Survey of Children's Health9
26 - Child mortality rate per 100,000 children aged 1-9 years
County Dashboard Number - 12
The number of deaths among children, aged 1 through 9 years, per 100,000 children aged 1 through 9 years.
Estimates for the state total on the state level dashboard are provided by the Health Resources and Services Administration, a federal agency, and may be different from state totals on county dashboards that are generated by the NYS specific data sources.
State: National Vital Statistics System (NVSS)4
County: NYS Vital Statistics Event Registry5
27 - Percentage of children aged 2-4 years who are obese (sex-specific BMI-for-age 95th percentile or higher) in WIC
The number of children, aged 2 through 4 years, whose measured weight and measured height meet sex-specific, BMI-for-age percentile definitions for obesity per 100 children aged 2 through 4 years, in the Women, Infants, and Children (WIC) program.
Estimates for the state total on the state level dashboard are provided by the Health Resources and Services Administration, a federal agency, and may be different from state totals on county dashboards that are generated by the NYS specific data sources.
Special Supplemental Nutrition Program for Women, Infants, and Children (WIC)11
28 - Percentage of children and adolescents aged 10-17 years who are obese (BMI at or above the 95th percentile)
The number of children and adolescents, aged 10 through 17 years, who are obese (BMI at or above the 95th percentile) per 100 children and adolescents aged 10 through 17 years.
Note: Previous iterations of the dashboard had presented data as single-year estimates. Beginning with the 2022 dashboard update, data will be presented as two-year estimates, in accordance with the Health Resources and Services Administration's Federally Available Data (FAD) Resource Document.
National Survey of Children's Health9
29 - Percentage of children and adolescents aged 0-17 years who live in a supportive neighborhood
The number of children and adolescents, aged 0 through 17 years, who live in a supportive neighborhood (whose parents definitely agree to at least one of the following items and somewhat agree or definitely agree to the other two items: people in the neighborhood help each other out, watch out for each other's children, and know where to go for help in their community) per 100 children and adolescents aged 0 through 17 years.
Note: Previous iterations of the dashboard had presented data as single-year estimates. Beginning with the 2022 dashboard update, data will be presented as two-year estimates, in accordance with the Health Resources and Services Administration's Federally Available Data (FAD) Resource Document.
National Survey of Children's Health9
30 - Percentage of children and adolescents aged 0-17 years who live in a safe neighborhood
The number of children and adolescents, aged 0 through 17 years, who live in a safe neighborhood (whose parents definitely agree that their children are safe in their neighborhood) per 100 children and adolescents aged 0 through 17 years.
Note: Previous iterations of the dashboard had presented data as single-year estimates. Beginning with the 2022 dashboard update, data will be presented as two-year estimates, in accordance with the Health Resources and Services Administration's Federally Available Data (FAD) Resource Document.
National Survey of Children's Health9
Children with Special Health Care Needs
Indicator
Indicator Description and Note
Data Source
31 - Percentage of children and adolescents with special health care needs aged 0-17 years receiving care in a well-functioning system
The number of children and adolescents with special health care needs (CSHCN), aged 0 through 17 years, who received all components of a well-functioning system (family partnership, medical home, early screening, adequate insurance, easy access to services, and preparation for adult transition) per 100 CSHCN aged 0 through 17 years.
Note: Previous iterations of the dashboard had presented data as single-year estimates. Beginning with the 2022 dashboard update, data will be presented as two-year estimates, in accordance with the Health Resources and Services Administration's Federally Available Data (FAD) Resource Document.
National Survey of Children's Health9
32 - Percent of families participating in the Early Intervention Program, Part C, who report that early intervention services have helped the family know their rights
County Dashboard Number - 13
Families exiting the Early Intervention Program, Part C, who completed the Family Outcomes Survey, which is composed of 22 items based on the Impact on Family Scale. The percentage of positive responses was calculated by dividing the total number of positive responses (agreed, strongly agreed or very strongly agreed) by the total number of positive and negative responses (disagree, strongly disagree, very strongly disagree).
Note: Previously, the indicator on the state level dashboard was "Percentage of families participating in the Early Intervention Program (EIP) who meet or exceed the State's standard (person mean>=576) on the New York Impact on Family Scale". The definition changed with the 2018-2019 estimate, leading to a revision of the MCH 2020 objective and baseline year. The new methodology was applied to data from previous years to make them comparable.
State: NYS Early Intervention Program Family Outcomes Survey12
County: NYS Early Intervention Program Family Outcomes Survey12
33 - Percent of families participating in the Early Intervention Program, Part C, who report that early intervention services have helped the family effectively communicate their children's needs
County Dashboard Number - 14
Families exiting the Early Intervention Program, Part C, who completed the Family Outcomes Survey, which is composed of 22 items based on the Impact on Family Scale. The percentage of positive responses was calculated by dividing the total number of positive responses (agreed, strongly agreed or very strongly agreed) by the total number of positive and negative responses (disagree, strongly disagree, very strongly disagree).
Note: Previously, the indicator on the state level dashboard was "Percentage of families participating in the Early Intervention Program (EIP) who meet or exceed the State's standard (person mean>=576) on the New York Impact on Family Scale". The definition changed with the 2018-2019 estimate, leading to a revision of the MCH 2020 objective and baseline year. The new methodology was applied to data from previous years to make them comparable.
State: NYS Early Intervention Program Family Outcomes Survey12
County: NYS Early Intervention Program Family Outcomes Survey12
34 - Percent of families participating in the Early Intervention Program, Part C, who report that early intervention services have helped the family help their children develop and learn
County Dashboard Number - 15
Families exiting the Early Intervention Program, Part C, who completed the Family Outcomes Survey, which is composed of 22 items based on the Impact on Family Scale. The percentage of positive responses was calculated by dividing the total number of positive responses (agreed, strongly agreed or very strongly agreed) by the total number of positive and negative responses (disagree, strongly disagree, very strongly disagree).
Note: Previously, the indicator on the state level dashboard was "Percentage of families participating in the Early Intervention Program (EIP) who meet or exceed the State's standard (person mean>=576) on the New York Impact on Family Scale". The definition changed with the 2018-2019 estimate, leading to a revision of the MCH 2020 objective and baseline year. The new methodology was applied to data from previous years to make them comparable.
State: NYS Early Intervention Program Family Outcomes Survey12
County: NYS Early Intervention Program Family Outcomes Survey12
35 - Percentage of adolescents with special health care needs aged 12-17 years who received services needed for transition to adult health care
The number of adolescents with special health care needs, aged 12 through 17 years, whose families report that they received the services necessary to transition to adult health care per 100 adolescents aged 12 through 17 years.
Note: Previous iterations of the dashboard had presented data as single-year estimates. Beginning with the 2022 dashboard update, data will be presented as two-year estimates, in accordance with the Health Resources and Services Administration's Federally Available Data (FAD) Resource Document.
National Survey of Children's Health9
36 - Percentage of infants who received a diagnostic hearing test after failing their most recent hearing screening
The number of infants who received a diagnostic hearing test that is documented in the New York Early Hearing Detection and Intervention Information System (NYEHDI-IS) per 100 infants whose most recent newborn hearing screening results were abnormal.
Early Hearing Detection and Intervention (EHDI) Program13
37 - Percentage of children aged 3-17 years who currently have Autism or Autism Spectrum Disorder
The number of children, aged 3 through 17 years, reported by their parents to currently have Autism or Autism Spectrum Disorder per 100 children aged 3 through 17 years.
Note: Previous iterations of the dashboard had presented data as single-year estimates. Beginning with the 2022 dashboard update, data will be presented as two-year estimates, in accordance with the Health Resources and Services Administration's Federally Available Data (FAD) Resource Document.
National Survey of Children's Health9
38 - Percentage of children and adolescents aged 3-17 years with a mental/behavioral condition who received treatment or counseling from a mental health professional during the past 12 months
The number of children and adolescents, aged 3 through 17 years, with a mental/behavioral condition who received treatment or counseling from a mental health professional during the past 12 months per 100 children and adolescents, aged 3 through 17 years with a mental/behavioral condition.
Note: Previous iterations of the dashboard had presented data as single-year estimates. Beginning with the 2022 dashboard update, data will be presented as two-year estimates, in accordance with the Health Resources and Services Administration's Federally Available Data (FAD) Resource Document.
National Survey of Children's Health9
Adolescent Health
Indicator
Indicator Description and Note
Data Source
39 - Percentage of adolescents aged 12-17 years with a preventive medical visit in the past year
The number of adolescents, aged 12 through 17 years, who had one or more preventive medical visits in the past year per 100 adolescents aged 12 through 17 years.
Note: This measure was affected by a 2018 wording change to a question on the National Survey of Children's Health (NSCH). In 2019, the NSCH question was reverted to the original wording. Due to the change, 2018 data were not provided. Single-year estimates for 2017 were also not provided.
National Survey of Children's Health9
40 - Percentage of adolescents in grades 9-12 who felt sad or hopeless for two or more weeks in a row in the past year
The number of adolescents in grades 9 through 12 who felt sad or hopeless almost every day for 2 or more weeks in a row so that they stopped doing some usual activities during the 12 months before the survey per 100 adolescents in grades 9 through 12.
Youth Risk Behavior Surveillance System14
41 - Percentage of adolescents aged 12-17 years who were physically active at least 60 minutes per day in the past week
The number of adolescents, aged 12 through 17 years, who were reported by their parents to be physically active at least 60 minutes per day in the past week per 100 children and adolescents aged 12 through 17 years.
Note: Previous iterations of the dashboard had presented data as single-year estimates. Beginning with the 2022 dashboard update, data will be presented as two-year estimates, in accordance with the Health Resources and Services Administration's Federally Available Data (FAD) Resource Document.
National Survey of Children's Health9
42 - Child and adolescent mortality, rate per 100,000 population aged 10-19 years
County Dashboard Number - 16
The number of deaths among children and adolescents, aged 10 through 19 years, per 100,000 children and adolescents aged 10 through 19 years.
Estimates for the state total on the state level dashboard are provided by the Health Resources and Services Administration, a federal agency, and may be different from state totals on county dashboards that are generated by the NYS specific data sources.
State: National Vital Statistics System (NVSS)4
County: NYS Vital Statistics Event Registry5
43 - Suicide mortality among youth, rate per 100,000 population aged 15-19 years
County Dashboard Number - 17
The number of deaths with an ICD-10 underlying cause of death code: X60-X84 or Y87.0, or U03 per 100,000 adolescents aged 15 through 19 years.
Estimates for the state total on the state level dashboard are provided by the Health Resources and Services Administration, a federal agency, and may be different from state totals on county dashboards that are generated by the NYS specific data sources.
State: National Vital Statistics System (NVSS)4
County: NYS Vital Statistics Event Registry5
44 - Percentage of adolescents in grades 9-12 who are obese (BMI at or above the 95th percentile)
The number of adolescents in grades, 9 through 12, who are obese (BMI at or above the 95th percentile) per 100 adolescents in grades 9 through 12.
Youth Risk Behavior Surveillance System14
45 - Percentage of children and adolescents aged 3-17 years with a mental/behavioral condition who received treatment or counseling from a mental health professional during the past 12 months
The number of children and adolescents, aged 3 through 17 years, with a mental/behavioral condition who received treatment or counseling from a mental health professional during the past 12 months per 100 children and adolescents, aged 3 through 17 years with a mental/behavioral condition.
Note: Previous iterations of the dashboard had presented data as single-year estimates. Beginning with the 2022 dashboard update, data will be presented as two-year estimates, in accordance with the Health Resources and Services Administration's Federally Available Data (FAD) Resource Document.
National Survey of Children's Health9
46 - Percentage of children and adolescents aged 1-17 years who had one or more preventive dental care visits in the past year
The number of children and adolescents, aged 1 through 17 years, who had a preventive dental visit in the past year per 100 children and adolescents aged 1 through 17 years.
Note: Previous iterations of the dashboard had presented data as single-year estimates. Beginning with the 2022 dashboard update, data will be presented as two-year estimates, in accordance with the Health Resources and Services Administration's Federally Available Data (FAD) Resource Document.
National Survey of Children's Health9
47 - Percentage of NYS residents served by community water systems that have optimally fluoridated water
County Dashboard Number - 18
The number of residents served by community water systems with optimal fluoride levels per 100 residents served by community water systems.
The Safe Drinking Water Information System (SDWIS) contains information about public water systems (PWSs) as reported to EPA by the states. This information is used by regulatory agencies to help track PWS treatment processes, facility data, and compliance with drinking water requirements.
State: Safe Drinking Water Information System (SDWIS)10
County: Safe Drinking Water Information System (SDWIS)10
48 - Percentage of children and adolescents aged 1-17 years who have decayed teeth or cavities in the past 12 months
The number of children and adolescents, aged 1 through 17 years, who have decayed teeth or cavities in the past 12 months per 100 children and adolescents aged 1 through 17 years.
Note: Previous iterations of the dashboard had presented data as single-year estimates. Beginning with the 2022 dashboard update, data will be presented as two-year estimates, in accordance with the Health Resources and Services Administration's Federally Available Data (FAD) Resource Document.
National Survey of Children's Health9
49 - Percentage of children and adolescents aged 10-17 years who are obese (BMI at or above the 95th percentile)
The number of children and adolescents, aged 10 through 17 years, who are obese (BMI at or above the 95th percentile) per 100 adolescents aged 10 through 17 years.
Note: Previous iterations of the dashboard had presented data as single-year estimates. Beginning with the 2022 dashboard update, data will be presented as two-year estimates, in accordance with the Health Resources and Services Administration's Federally Available Data (FAD) Resource Document.
National Survey of Children's Health9
50 - Percentage of adolescents without special health care needs aged 12-17 years who received services needed for transition to adult health care
The number of adolescents without special health care needs, aged 12 through 17 years, whose families report that they received the services necessary to transition to adult health care per 100 adolescents aged 12 through 17 years.
Note: Previous iterations of the dashboard had presented data as single-year estimates. Beginning with the 2022 dashboard update, data will be presented as two-year estimates, in accordance with the Health Resources and Services Administration's Federally Available Data (FAD) Resource Document.
National Survey of Children's Health9
51 - Percentage of children and adolescents aged 0-17 years who live in a supportive neighborhood
The number of children and adolescents, aged 0 through 17 years, who live in a supportive neighborhood (whose parents definitely agree to at least one of the following items and somewhat agree or definitely agree to the other two items: people in the neighborhood help each other out, watch out for each other's children, and know where to go for help in their community) per 100 children and adolescents aged 0 through 17 years.
Note: Previous iterations of the dashboard had presented data as single-year estimates. Beginning with the 2022 dashboard update, data will be presented as two-year estimates, in accordance with the Health Resources and Services Administration's Federally Available Data (FAD) Resource Document.
National Survey of Children's Health9
52 - Percentage of children and adolescents aged 0-17 years who live in a safe neighborhood
The number of children and adolescents, aged 0 through 17 years, who live in a safe neighborhood (whose parents definitely agree that their children are safe in their neighborhood) per 100 children and adolescents aged 0 through 17 years.
Note: Previous iterations of the dashboard had presented data as single-year estimates. Beginning with the 2022 dashboard update, data will be presented as two-year estimates, in accordance with the Health Resources and Services Administration's Federally Available Data (FAD) Resource Document.
National Survey of Children's Health9
1 Behavioral Risk Factor Surveillance System (CDC)
- The BRFSS is an annual statewide random telephone (landline and cellphone) surveillance survey designed by the Centers for Disease Control
and Prevention (CDC). The survey is conducted in all 50 states and in all US territories. BRFSS monitors modifiable risk behaviors and
other factors contributing to the leading causes of morbidity and mortality in the population.
- The state level data for these indicators on the MCH dashboard from the BRFSS (CDC)
are provided in a Federally Available Data (FAD) Resource Document, from the Health Resources and Services Administration (HRSA).
HRSA obtains the data from BRFSS.
- 2 Behavioral Risk Factor Surveillance System (NYS)
County level data. The Expanded BRFSS (EBRFSS) augments the annual CDC Behavioral Risk Factor Surveillance System Survey (BRFSS).
The goal of the Expanded BRFSS is to collect county-specific data on preventative health practices, risk factors, injuries and preventable
chronic and infectious diseases. County level data are currently available for 2002-03, 2008-09, 2013-14, 2016 and 2018.
The New York State BRFSS website has further information.
- 3 New York State (NYS) Pregnancy Risk Assessment Monitoring System (PRAMS)
- New York State PRAMS is an ongoing mail/telephone survey of mothers who have recently given birth to a live born infant. PRAMS collects information from mothers about behaviors
and experiences before, during and after pregnancy to improve the health of mothers and infants by reducing adverse outcomes such as low birth weight, infant mortality and morbidity,
and maternal mortality and morbidity.
- 4 National Vital Statistics System (NVSS)
- The NVSS provides vital statistics data-births, deaths, marriages, divorces, and fetal deaths-through contracts between the National Center for Health Statistics and
vital registration systems operated in jurisdictions responsible for the registration of vital events. The state level data for indicators on the MCH dashboard from NVSS are provided
in a Federally Available Data (FAD) Resource Document, from the Health Resources and Services Administration (HRSA). HRSA obtains the data from NVSS.
- 5 Vital Records (Vital Statistics)
- Vital Event Registration:
New York State consists of two registration areas, New York City and New York State Exclusive of New York City (also referred
to as Rest of State). New York City (NYC) includes the five counties of Bronx, Kings (Brooklyn), New York (Manhattan), Queens and
Richmond (Staten Island); the remaining 57 counties comprise New York State Exclusive of New York City. The Bureau of Vital
Records, New York State Department of Health (NYSDOH), processes data from live birth, death, fetal death and marriage
certificates recorded in New York State Exclusive of New York City. Through a cooperative agreement, the New York State
Department of Health receives data on live births, deaths, fetal deaths and marriages recorded in New York City from the
New York City Department of Health and Mental Hygiene (NYCDOHMH). The New York State Department of Health also receives data,
from other states and Canada, on live births and deaths recorded outside of New York State to residents of New York State.
Vital Event indicators for NYC geographical areas reported by NYSDOH and NYCDOHMH may be different since the former may
include all NYC residents' events regardless of where they occurred and the latter reports only events to NYC residents that
occurred in NYC. The indicators may also differ due to timing and/or completeness of data.
The counts of births and deaths may be influenced by specific reporting issues each year. The specific issues are reported
in the NYSDOH Annual Vital Statistics Tables, in the Report Measures section of the Technical Notes.
All the vital statistics presented in this report are based on the county/borough of residence.
- 6 Healthcare Cost and Utilization Project-State Inpatient Database (HCUP-SID)
- The Healthcare Cost and Utilization Project (HCUP, pronounced "H-Cup") is a family of healthcare databases developed through a
Federal-State-Industry partnership and sponsored by the Agency for Healthcare Research and Quality (AHRQ). HCUP databases bring together the data collection
efforts of State data organizations, hospital associations, private data organizations, and the Federal government to create a national information resource
of encounter-level healthcare data. The State Inpatient Databases (SID) are State-specific files that contain all inpatient care records in participating states.
Together, the SID encompass more than 95 percent of all U.S. hospital discharges. The uniform format of the SID helps facilitate cross-state comparisons.
- The state level data for the indicator on the MCH dashboard from HCUP-SID are provided in a Federally Available Data (FAD) Resource Document, from the Health Resources and Services Administration (HRSA).
HRSA obtains the data from HCUP-SID.
- 7 Statewide Planning and Research Cooperative System (SPARCS)
- Information about hospitalizations is collected through the hospital inpatient discharge data system. Each hospitalization receives an ICD-10-CM code
at discharge that indicates the primary reason for the hospitalization. There are also up to 24 other diagnosis codes recorded to further describe
the hospitalization. Statistics presented in these tables are based on the primary diagnosis unless otherwise noted. This data system does not include
information about events that did not result in a hospitalization, such as cases that were only treated in a hospital emergency room. Numbers and rates
are based on the number of hospitalizations that occurred and not the number of individuals who were hospitalized. SPARCS measures provided are generated
based on patient residence county at time of discharge. If county is not known, county is assigned based on ZIP Code.
- 8 Centers for Medicare and Medicaid (CMS) Hospital Compare
- The CMS Hospital Care Compare provides information on the quality of care that hospitals provide to help consumers make informed decisions about health care.
Hospital Care Compare provides data on over 4,000 Medicare-certified hospitals, including acute care hospitals, critical access hospitals (CAHs), children's hospitals,
Veterans Health Administration (VHA) Medical Centers, Department of Defense (DoD) and hospital outpatient departments (Hospital Downloadable Database Data Dictionary, CMS,
https://data.cms.gov/provider-data/topics/hospitals).
- The state level data for the indicator on the MCH dashboard from CMS are provided in a Federally Available
Data (FAD) Resource Document, from the Health Resources and Services Administration (HRSA).
HRSA obtains the data from CMS.
- 9 National Survey of Children's Health (NSCH)
- The NSCH provides data on multiple aspects of children's lives-including physical and mental health, access to quality health care,
and the child's family, neighborhood, school, and social context. The survey is funded and directed by the Health Resources and Services Administration (HRSA)
Maternal and Child Health Bureau (MCHB).
- The state level data for the indicators on the MCH dashboard from NSCH are provided in a Federally Available Data (FAD)
Resource Document from HRSA. HRSA obtains the data from NSCH.
- Note: Two NSCH indicators on the MCH dashboard not provided in FAD are directly taken from the National Survey of Children's Health: #29 and #49 Percentage of children and adolescents who live in a supportive neighborhood,
and #30 and #50 Percentage of children and adolescents who live in a safe neighborhood.
- 10 Safe Drinking Water Information System (SDWIS)
- The SDWIS is an EPA-maintained database about public water systems across the US and violations and enforcement of drinking water regulations under
the Safe Drinking Water Act (SDWA).
- 11 Special Supplemental Nutrition Program for Women, Infants, and Children (WIC)
- The Special Supplemental Nutrition Program for Women, Infants, and Children (WIC) provides federal grants to states for supplemental foods, health care referrals,
and nutrition education for low-income pregnant, breastfeeding, and non-breastfeeding postpartum women, and to infants and children up to age five who are found to be at nutritional risk.
- The state level data for the indicator on the MCH dashboard from WIC are provided in a Federally Available Data (FAD) Resource Document, from the Health Resources and Services Administration (HRSA). HRSA obtains the data from WIC.
- 12 New York State Early Intervention Program (EIP) Family Outcome Survey
- The New York State EIP Family Outcomes Survey collects information about the ways in which the EIP helps families of children receiving early intervention services.
The New York State EIP is part of the national EIP, a program that identifies and evaluates, as early as possible, infants and toddlers whose healthy development is compromised and
provides for appropriate intervention to improve child and family development.
- 13 Early Hearing Detection and Intervention (EHDI) Program
- The New York State EHDI program supports the US Surgeon General's Healthy People 2020 goal ENT-VSL-1 to increase the proportion of newborns who are screened for hearing loss by no later than age 1 month,
have audiologic evaluation by age 3 months, and are enrolled in appropriate intervention services no later than age 6 months. If a hearing loss is detected after screenings and assessment, the infant is
referred to the NYS Early Intervention Program (EIP) for appropriate intervention services.
- 14 Youth Risk Behavior Surveillance System (YRBSS)
- The YRBSS is a national survey of youth and young adults in the US. It was developed to monitor priority health risk behaviors that are often
established in childhood and adolescence. The YRBSS has been conducted every two years since 1991 and surveys high school students on substance use,
physical activity, obesity, asthma, dietary behaviors, sexual behaviors, behaviors related to injuries and violence, and other health-related behaviors.
The national survey is conducted by CDC and the state, territorial, and tribal governments; and local surveys are conducted by state, territorial, and local
education and health agencies and tribal governments.
- Methodology and Limitations
-
Index
- Types of Estimates
- Unstable Estimates
- Direction of Indicator Estimates
- Grouping County Estimates into Three Categories
- Comparing the Maternal and Child Health Estimates with the Maternal and Child Health Objectives
- Assessing the Indicator Performance
- Data Filters
- Data Suppression for Confidentiality
- Limitations/Cautions
- References
Types of Estimates
- Percentage: Percentages are calculated per 100 population (births, deaths, families).
For example, the number of births (excluding births without a known prenatal care start date) that began prenatal care
within the first three months of pregnancy (1st trimester) per 100 live births.
- Weighted percentage: Weighted percentages are generated when presenting results from
survey data (for example, Behavioral Risk Factor Surveillance System (BRFSS), Youth Risk Behavior Surveillance Survey (YRBSS),
National Child Health Survey (NCHS)) which ensures that the data are as representative of New York's population as possible.
Weighted estimates are shown as a percentage (%) and corresponding 95% confidence intervals (CI) are presented when available.
- Rate: A rate is a measure of the frequency with which an event occurs in a defined
population over a specified period of time. Rates used for the Maternal and Child Health tracking measures are
per 1,000, 10,000 or 100,000 population (births, deaths, hospitalizations).
Unstable Estimates
Multiple years of data were combined to generate more stable estimates when the number of events for an indicator
was small (i.e., rare conditions).
The relative standard error (RSE) is a tool for assessing reliability of an estimate. A large RSE is produced when
estimates are calculated based on a small number of cases.1 Estimates with large
RSEs are considered less reliable than estimates with small RSEs. The
National Center for Health Statistics recommends that estimates with RSEs greater than 30% should be considered
unreliable/unstable.2
The RSE is calculated by dividing the standard error of the estimate by the estimate itself, then multiplying that
result by 100. The RSE is expressed as a percent of the estimate.
For the Maternal and Child Health dashboard, an asterisk (*) symbol is used to indicate that a percentage or rate
is unreliable/unstable. This usually occurs when there are fewer than 10 events in the numerator (RSE is greater
than 30%).
Direction of Indicator Estimates
Maternal and Child Health tracking indicators fall into two categories regarding the direction of their estimates.
Sometimes lower estimates are better (e.g., child and adolescent mortality rate ages 10-19 years per 100,000 population)
and in other cases higher estimates are better (e.g., the percentage of births with early (1st trimester) prenatal care).
This direction of the Maternal and Child Health tracking measure is important to note because the county bar chart,
map, and dial use color categories that are based on the direction of the Maternal and Child Health tracking measure.
The measure performance is also based on the direction of the Maternal and Child Health tracking indicator.
Some indicators are tracked, but there is no desired direction (e.g., percentage of children aged 3-17 years who currently have Autism or Autism Spectrum Disorder). For these indicators, "Increased" or "Decreased" is used instead to indicate change from the previous data period.
Grouping County Estimates into Three Categories for the County Dial, County Maps, and County Bar Charts
Color Categories Defined
For each Maternal and Child Health tracking indicator, dials, maps, and bar charts are generated when there are enough counties with
data different from each other so that dials, maps, and charts can show meaningful differences among the counties. In particular,
dials, maps, and charts are not generated if 46 or more counties have rates that are equal to 0 or are missing,
or if more than half the counties have the same rate. Dials, maps, and charts are generated all other times.
Tables are generated for all indicators in all counties, regardless of rate values.
When dials, maps, and charts are generated, county estimates are grouped into three categories: yellow, green, and blue.
These categories are displayed consistently in the county dial, the bar chart, and the New York State map for each tracking indicator.
The three colors represent the quartile distribution of estimates for the counties ordered from those doing the
best to those doing the worst.
For Maternal and Child Health tracking indicators where lower estimates are better (e.g., child and adolescent
mortality rate ages 10-19 years per 100,000 population):
- The LIGHT GREEN category includes counties which are performing the best (i.e., 50% of counties with the
lowest
estimates; those in quartile 1 and quartile 2) and is the most favorable category for a county's estimate to be in.
- The DARK BLUE category includes counties which are performing the worst (i.e., 25% of counties with the
highest estimates; those in quartile 4) and is the least favorable category for a county's
estimate to be in.
- The BLUE-GREEN category includes counties which are performing in the middle (i.e., 25% of counties or those in quartile 3).
For Maternal and Child Health tracking indicators where higher estimates are better (e.g., the percentage
of births with early (1st trimester) prenatal care):
- The LIGHT GREEN category includes counties which are performing the best (i.e., 50% of counties with the
highest estimates; those in quartile 3 and quartile 4) and is the most favorable category for a
county's estimate to be in.
- The DARK BLUE category includes counties which are performing the worst (i.e., 25% of counties with the
lowest estimates; those in quartile 1) and is the least favorable category for a county's estimate to be in.
- The BLUE-GREEN category includes counties which are performing in the middle (i.e., 25% of counties or
those with estimates in quartile 2).
Length of Color Categories in the County Dial
The length of each color in the county dial represents the minimum and maximum values or cut-off points
for the three categories. If the blue area is very big, this indicates that the range of county estimates is large;
while a small area indicates a small range of county estimates.
For example, a county dial for one indicator shows a very large dark blue area which ranges from 24.8-57.1; while the blue-green area ranges from 16.8-<24.8
and has a narrower width; similarly, the light green area has a narrow range of estimates from 0.0-<16.8.

Color Switch in County Dial Based on Direction of Indicator Estimates
For Maternal and Child Health tracking indicators where lower estimates are better (e.g., infant
mortality rate per 1,000 live births), the dark blue category is displayed on the right side of the
dial.
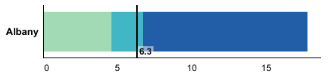
For Maternal and Child Health tracking indicators where higher estimates are better (e.g., the percentage
of births with early (1st trimester) prenatal care), the dark blue category is displayed on the left side
of the dial.

Comparing the Maternal and Child Health Estimates with the Maternal and Child Health Objectives
A green color in bar charts or for a number displayed in a data table indicates that the current value for
the Maternal and Child Health tracking indicator met the Maternal and Child Health 2020 Objective. A red color
in bar charts or for a number displayed in a data table indicates that the current value for the Maternal and Child Health
tracking indicator did not meet the Maternal and Child Health 2020 Objective.
Assessing the Indicator Performance
Three different methods were used to assess indicator performance.
- Conduct one-sided z-test to assess the change (increase/decrease or improve/worsen) in estimates between the two most
recent time periods.3 The p-value for rejecting the null hypothesis is less than or equal to 0.05 and the critical
value for the one-sided test (p-value at 0.05) is 1.645.
- A comparison of confidence intervals of estimates for the two most recent time periods was performed
where this method was more appropriate. A confidence interval is a range around an estimate
that conveys how precise the estimate is. Differences between estimates are considered "statistically significant" when the estimates
being compared do not have overlapping confidence intervals. For the purposes of this dashboard, in cases where the confidence intervals
overlap, the difference is interpreted as not statistically significant at the 95% confidence level.
For survey related indicators, estimates and the two-sided 95% confidence intervals were obtained and used.
In some instances for count data (e.g., births, deaths, hospitalizations, and emergency department visits),
we calculated the one-sided 95% confidence intervals for the estimates and used them for comparison to evaluate
the indicator performance.4
NOTE: This method is an approximation of a statistical
test and may result in a more conservative finding. In some cases, an appropriate statistical test would indicate a statistically
significant difference even though the confidence intervals overlap and falsely imply no significant difference.
When two confidence intervals do not overlap, though, a comparable statistical test would always indicate a statistically
significant difference.5
- Simple comparison was conducted where the two estimates were directly compared to each other
based on their magnitude. This was performed when there was not a sufficient amount of data to conduct significance
testing; or if confidence intervals could not be calculated; or if there is some overlap of the two time intervals being
compared (e.g., 2014-2016 and 2015-2017 maternal mortality indicators).
The categories for the Indicator Performance
are as follows:
- Significantly improved
- Significantly worsened
- No significant change
- Improved^
- Worsened^
- Increased^
- Decreased^
- No change^
- Baseline data
The "^" sign indicates that the performance was determined using simple comparison and not statistical tests.
Programs which provide the data also indicate the time period they use as a baseline. Indicator performance is
listed as "Baseline data" until updated data are available for assessing indicator performance.
See Table 1 below for statistical significance techniques used for each type of data source to assess
the indicator performance.
Use caution when interpreting significance. For more common conditions (i.e., high incidence rates), there is a
higher likelihood that a relatively small change could be detected as statistically significant. Conversely,
for rare conditions, the likelihood of detecting a statistically significant change is low even for reasonable changes.
Data Filters
Several data filters are available at state and county levels to quickly select measures based on commonly desired criteria
such as measure data status as being compared to the Maternal and Child Health 2020 targets or measure performance over time.
Multiple filters could be selected simultaneously.
- State data filters: two data filters are available for state level indicators.
- Filter on meeting 2020 objective target: This filter displays indicators where the most recent state level data meet
or do not meet the Maternal and Child Health 2020 objectives.
- Filter on indicator performance over time: The performance status for each indicator is generated by comparing state level data
for the two most recent time periods. This filter displays indicators based on indicator performance categories selected.
- County data filters: three data filters are available for county level indicators.
- Filter on meeting 2020 objective target: This filter displays indicators where the most recent specific county data meet
or do not meet the Maternal and Child Health 2020 objectives.
- Filter on indicator performance over time: The performance status for each indicator is generated by comparing estimates
for the two most recent time periods for a specific county. This filter displays indicators based on indicator performance categories selected.
- Filter on county's position of risk: This filter displays indicators based on the relative position represented by the pointer
on the County Dial for risk categories selected.
Data Suppression for Confidentiality
Results are not shown (i.e., suppressed) when issues of confidentiality exist. Suppression rules vary depending
on the data source and the indicator.
Table 1. Summary of data suppression and statistical evaluation significance for the Maternal and Child Health Indicators
by data source
Data Sources
Suppression Criteria
Statistical Significance Techniques
Sample Surveys
BRFSS (NYS)
Unweighted numerator <6 or Unweighted denominator <50
95% CI comparison
BRFSS (CDC)
Unweighted denominator <30
95% CI comparison
NSCH
Unweighted denominator <30
95% CI comparison
YRBSS
Unweighted denominator < 100
95% CI comparison
NYS PRAMS
Unweighted denominator < 30
95% CI comparison
Population Count Data
NYS VS
Denominator population or event <30
Rate/percentage: one sided chi-square test with p-value <0.05
NYS SPARCS
Numerator between 1 - 5 cases
Rate/percentage: one sided chi-square test with p-value <0.05
HCUP-SID
Numerator <=10
Rate/percentage: one sided chi-square test with p-value <0.05
NVSS
Numerator <10
Rate/percentage: one sided chi-square test with p-value <0.05
Special Supplemental Nutrition Program for WIC
Indicator has a denominator <50
Rate/percentage: one sided chi-square test with p-value <0.05
CI: Confidence Interval
BRFSS: Behavioral Risk Factor Surveillance System
SPARCS: Statewide Planning and Research Cooperative System
Vital Statistics: New York State Vital Statistics (NYS VS Event Registry)
YRBSS: Youth Risk Behavioral Surveillance System
PRAMS: Pregnancy Risk Assessment Monitoring System
HRSA provided data6 are from the following sources:
BRFSS (CDC): Behavioral Risk Factor Surveillance System
HCUP-SID: Healthcare Cost and Utilization Project-State Inpatient Database
NSCH:National Survey of Children"s Health
NVSS: National Vital Statistics System (Natality and Death)
WIC: Women, Infants, and Children (Special Supplemental Nutrition Program)
CMS: Centers for Medicare and Medicaid Services
Limitations/Cautions
State estimates for many measures on the state level dashboard are provided by the Health
Resources and Services Administration6 (HRSA), a federal agency, while state estimates for
these measures on the county level dashboard are generated by the New York State Department
of Health (NYSDOH), using NYS specific data sources. Therefore, the values for NYS from
state level dashboard and county level dashboard for the same measure may not be completely
the same due to the differences in data sources and/or definitions.
Note: The 2018 population estimates are also used to calculate rates for 2019 and 2020.
References
- About Age Adjusted Rates, 95% Confidence Intervals and Unstable Rates.
(see: www.health.ny.gov/statistics/cancer/registry/age.htm)
- Klein RJ, Proctor SE, Boudreault MA, Turczyn KM. Healthy People 2010 criteria for data suppression.
Statistical Notes, no 24. Hyattsville, Maryland: National Center for Health Statistics. June 2002.
(see: www.cdc.gov/nchs/data/statnt/statnt24.pdf)
- Statistical Significance (see:
www.health.ny.gov/statistics/chac/chai/docs/statistical_significance.pdf)
- One-sided 95% confidence interval
(see:
https://www.graphpad.com/guides/prism/6/statistics/one_sided_confidence_intervals.htm)
- Guidelines for using confidence intervals for public health assessment, Washington State
Department of Health, (see:
www.doh.wa.gov/Portals/1/Documents/1500/ConfIntGuide.pdf)
- Title V Maternal and Child Health (MCH) Services Block Grant Program Resource Page,
(see: Guidance and Documents Federally Available Data (FAD) Resource Document.
| Maternal and Women's Health | ||||
|---|---|---|---|---|
| Indicator | Indicator Description and Note | Data Source | ||
| 1 - Percentage of women aged 18-44 years with a preventive medical visit in the past year |
The number of women, aged 18 through 44 years, who had a routine preventive medical visit in the past year per 100 women aged 18 through 44 years. Estimates for the state total on the state level dashboard are provided by the Health Resources and Services Administration, a federal agency, and may be different from state totals on county dashboards that are generated by the NYS specific data sources. Note: The definition changed in 2018 and is not comparable to previous survey years; thus, only data from 2018 and onward are shown. |
Behavioral Risk Factor Surveillance System (CDC)1 |
||
| 2 - Percentage of women aged 18-44 years who report ever talking with a health care provider about ways to prepare for a healthy pregnancy County Dashboard Number - 1 |
The number of women, aged 18 through 44 years, who talked with a health care provider about ways to prepare for a healthy pregnancy per 100 women aged 18 through 44 years. | Behavioral Risk Factor Surveillance System (NYS)2 |
||
| 3 - Percentage of women who had a dental visit for teeth cleaning during pregnancy |
The number of women who had a preventive dental visit for teeth cleaning during pregnancy per 100 women who had a live birth. | Pregnancy Risk Assessment Monitoring System (NYS)3 |
||
| 4 - Percentage of births with early (1st trimester) prenatal care County Dashboard Number - 2 |
The number of births (excluding births without a known prenatal care start date) that began prenatal care within the first three months of pregnancy (1st trimester) per 100 live births. Estimates for the state total on the state level dashboard are provided by the Health Resources and Services Administration, a federal agency, and may be different from state totals on county dashboards that are generated by the NYS specific data sources. |
State: National Vital Statistics System4 County: NYS Vital Statistics Event Registry5 |
||
| 5 - Rate of severe maternal morbidity per 10,000 delivery hospitalizations |
The number of delivery hospitalizations that meet the CDC-developed definition of severe maternal morbidity identified from hospital discharge procedures and diagnosis codes that indicate a potentially life-threatening condition or maternal complication (Callaghan et al, 2012) per 10,000 delivery hospitalizations. Delivery hospitalizations were identified by diagnosis codes for an outcome of delivery, diagnosis-related group delivery codes, and procedure codes for selected delivery-related procedures (Kuklina et al, 2008). State-level estimates include inpatient stays for state residents treated in their home state and state residents treated in other states that provide data to the Healthcare Cost and Utilization Project (HCUP). Estimates on the state level dashboard are provided by the Health Resources and Services Administration, a federal agency, and may be different from results that are generated by the NYS specific data sources. Note: Data for 2016 and onward are based on ICD-10-CM/PCS and may not be comparable to previous ICD-9-CM estimates; thus, only data from 2016 and onward are shown. This measure was also revised to exclude blood transfusions, leading to a revision of the MCH 2020 objective and baseline year. Callaghan WM, Creanga AA, Kuklina EV. Severe maternal morbidity among delivery and postpartum hospitalizations in the United States. Obstet Gynecol. 2012 Nov;120(5):1029-36. Kuklina EV, Whiteman MK, Hillis SD, Jamieson DJ, Meikle SF, Posner SF, et al. An enhanced method for identifying obstetric deliveries: implications for estimating maternal morbidity. Matern Child Health J 2008;12:469-77. |
Healthcare Cost and Utilization Project-State Inpatient Database (HCUP-SID)6 |
||
| 6 - Maternal mortality rate per 100,000 live births County Dashboard Number - 3 |
The number of deaths related to or aggravated by pregnancy and occurring within 42 days of the end of pregnancy (defined as death records with causes of death ICD-10: A34, O00-O95, O98-O99) per 100,000 live births. Estimates on the state level dashboard are provided by the Health Resources and Services Administration, a federal agency, and may be different from results that are generated by the NYS specific data sources. Note: Beginning with 2014 data at the state level, there was an improvement in data validation using women's age and pregnancy status. Data prior to 2014 are not comparable; thus, only time periods starting with 2014 and onward are shown. |
State: National Vital Statistics System4 County: NYS Vital Statistics Event Registry5 |
||
| 7 - Newborns with neonatal withdrawal symptoms and/or affected by maternal use of drugs of addiction (any diagnosis), crude rate per 1,000 newborn discharges County Dashboard Number - 4 |
Neonatal withdrawal symptoms from maternal use of drugs of addiction, and/or newborns affected by maternal use of drugs of addiction (other than cocaine). ICD-10-CM: Principal Diagnosis: Z38 (liveborn infants) AND P96.1 (neonatal withdrawal symptoms from maternal use of drugs of addiction) or P04.49 (newborns affected by maternal use of drugs of addiction (other than cocaine)) or P04.14 (newborns affected by maternal use of opiates) or P04.17 (newborns affected by maternal use of sedative-hypnotics) or P04.1A (newborns affected by maternal use of anxiolytics) in any other diagnoses. P04.14, P04.17, and P04.1A are three new codes effect 10/1/2018.
Note: Data for 2016 and onward are based on ICD-10-CM and may not be comparable to previous ICD-9-CM estimates; thus, only data from 2016 and onward are shown. Estimates on the state level dashboard were previously taken from the Health Resources and Services Administration's Federally Available Data (FAD) Resource Document, but now come from the NYS SPARCS database using a revised definition. Direct comparisons between the two data sources are not recommended. |
State: Statewide Planning and Research Cooperative System (SPARCS)7 County: Statewide Planning and Research Cooperative System (SPARCS)7 |
||
| 8 - Percentage of non-medically indicated early elective deliveries |
The number of inductions or cesareans without labor or spontaneous rupture of membranes among deliveries at 37, 38 weeks' gestation without conditions possibly justifying elective delivery <39 weeks per 100 deliveries at 37, 38 weeks' gestation without conditions possibly justifying elective delivery <39 weeks. Indicator data reflect all births in Medicare-certified hospitals (virtually all US hospitals excluding critical access and VHA hospitals). Estimates for the state total on the state level dashboard are provided by the Health Resources and Services Administration, a federal agency, and may be different from state totals on county dashboards that are generated by the NYS specific data sources. |
CMS Hospital Compare8 |
||
| Perinatal and Infant Health | ||||
| Indicator | Indicator Description and Note | Data Source | ||
| 9 - Infant mortality rate per 1,000 live births County Dashboard Number - 5 |
The number of infant deaths up to 364 days of age per 1,000 live births. Estimates for the state total on the state level dashboard are provided by the Health Resources and Services Administration, a federal agency, and may be different from state totals on county dashboards that are generated by the NYS specific data sources. |
State: National Vital Statistics System4 County: NYS Vital Statistics Event Registry5 |
||
| 10 - Neonatal mortality rate per 1,000 live births County Dashboard Number - 6 |
The number of infant deaths under 28 days of age per 1,000 live births. Estimates for the state total on the state level dashboard are provided by the Health Resources and Services Administration, a federal agency, and may be different from state totals on county dashboards that are generated by the NYS specific data sources. |
State: National Vital Statistics System4 County: NYS Vital Statistics Event Registry5 |
||
| 11 - Post-neonatal mortality rate per 1,000 live births County Dashboard Number - 7 |
The number of infant deaths from 28 to 364 days of age per 1,000 live births. Estimates for the state total on the state level dashboard are provided by the Health Resources and Services Administration, a federal agency, and may be different from state totals on county dashboards that are generated by the NYS specific data sources. |
State: National Vital Statistics System4 County: NYS Vital Statistics Event Registry5 |
||
| 12 - Perinatal mortality rate per 1,000 live births plus fetal deaths County Dashboard Number - 8 |
Perinatal mortality rate is defined as the number of infant deaths under 7 days of age and fetal deaths at 28 weeks or more of gestation per 1,000 live births plus fetal deaths at 28 weeks or more of gestation. Estimates for the state total on the state level dashboard are provided by the Health Resources and Services Administration, a federal agency, and may be different from state totals on county dashboards that are generated by the NYS specific data sources. |
State: National Vital Statistics System4 County: NYS Vital Statistics Event Registry5 |
||
| 13 - Sudden Unexpected Infant Death (SUID) rate per 1,000 live births |
The number of SUIDs per 1,000 live births. Estimates on the state level dashboard are provided by the Health Resources and Services Administration, a federal agency, and may be different from results that are generated by the NYS specific data sources. |
National Vital Statistics System4 |
||
| 14 - Percentage of infants placed to sleep on their backs |
The number of mothers reporting that they most often place their baby to sleep on their back only, per 100 women who had a live birth. Excluding those whose babies have died or are not living with them. | Pregnancy Risk Assessment Monitoring System (NYS)3 |
||
| 15 - Preterm-related mortality rate per 100,000 live births |
The number of deaths due to preterm-related causes among the number of live births per 100,000. Causes are defined as preterm-related if 75% or more of infants whose deaths were attributed to that cause were born at less than 37 weeks of gestation, and the cause of death was a direct consequence of preterm birth. This includes low birth weight, several maternal complications, respiratory distress, bacterial sepsis, etc. To be included as a preterm-related death, the infant must have been born preterm (<37 completed weeks of gestation) with the underlying cause of death assigned to one of the following ICD-10 categories: K550, P000, P010, P011, P015, P020, P021, P027, P070-P073, P102, P220-229, P250-279, P280, P281, P360-369, P520-523, and P77. Estimates for the state total on the state level dashboard are provided by the Health Resources and Services Administration, a federal agency, and may be different from state totals on county dashboards that are generated by the NYS specific data sources. |
National Vital Statistics System4 |
||
| 16 - Percentage of preterm births (less than 37 weeks gestation) County Dashboard Number - 9 |
The number of infants born at less than 37 weeks clinically estimated gestation per 100 live births with known gestational age. | State: NYS Vital Statistics Event Registry5 County: NYS Vital Statistics Event Registry5 |
||
| 17 - Percentage of very low birth weight (VLBW) infants born in a hospital with a Level III+ Neonatal Intensive Care Unit (NICU) |
The number of VLBW infants born in a hospital with a level III or higher NICU per 100 VLBW infants (< 1500 grams). | NYS Vital Statistics Event Registry5 |
||
| 18 - Newborns with neonatal withdrawal symptoms and/or affected by maternal use of drugs of addiction (any diagnosis), crude rate per 1,000 newborn discharges County Dashboard Number - 10 |
Neonatal withdrawal symptoms from maternal use of drugs of addiction, and/or newborns affected by maternal use of drugs of addiction (other than cocaine). ICD-10-CM: Principal Diagnosis: Z38 (liveborn infants) AND P96.1 (neonatal withdrawal symptoms from maternal use of drugs of addiction) or P04.49 (newborns affected by maternal use of drugs of addiction (other than cocaine)) or P04.14 (newborns affected by maternal use of opiates) or P04.17 (newborns affected by maternal use of sedative-hypnotics) or P04.1A (newborns affected by maternal use of anxiolytics) in any other diagnoses. P04.14, P04.17, and P04.1A are three new codes effect 10/1/2018.
Note: Data for 2016 and onward are based on ICD-10-CM and may not be comparable to previous ICD-9-CM estimates; thus, only data from 2016 and onward are shown. Estimates on the state level dashboard were previously taken from the Health Resources and Services Administration's Federally Available Data (FAD) Resource Document, but now come from the NYS SPARCS database using a revised definition. Direct comparisons between the two data sources are not recommended. |
State: Statewide Planning and Research Cooperative System (SPARCS)7 County: Statewide Planning and Research Cooperative System (SPARCS)7 |
||
| Child Health | ||||
| Indicator | Indicator Description and Note | Data Source | ||
| 19 - Percentage of children and adolescents aged 0-17 years who are in excellent or very good health |
The number of children and adolescents, aged 0 through 17 years, reported by their parents to be in excellent or very good health per 100 children and adolescents aged 0 through 17 years.
Note: Previous iterations of the dashboard had presented data as single-year estimates. Beginning with the 2022 dashboard update, data will be presented as two-year estimates, in accordance with the Health Resources and Services Administration's Federally Available Data (FAD) Resource Document. |
National Survey of Children's Health9 |
||
| 20 - Percentage of children aged 9-35 months who received a developmental screening using a parent-completed screening tool in the past year |
The number of children, aged 9 through 35 months, who had a health care visit in the past 12 months and whose parents completed a Standardized Developmental Screening tool in the past 12 months per 100 children, aged 9 through 35 months, who had a health care visit in the past 12 months.
Note: Previous iterations of the dashboard had presented data as single-year estimates. Beginning with the 2022 dashboard update, data will be presented as two-year estimates, in accordance with the Health Resources and Services Administration's Federally Available Data (FAD) Resource Document. |
National Survey of Children's Health9 |
||
| 21 - Percentage of children and adolescents aged 3-17 years with a mental/behavioral condition who received treatment or counseling from a mental health professional during the past 12 months |
The number of children and adolescents, aged 3 through 17 years, with a mental/behavioral condition who received treatment or counseling from a mental health professional during the past 12 months per 100 children and adolescents, aged 3 through 17 years with a mental/behavioral condition.
Note: Previous iterations of the dashboard had presented data as single-year estimates. Beginning with the 2022 dashboard update, data will be presented as two-year estimates, in accordance with the Health Resources and Services Administration's Federally Available Data (FAD) Resource Document. |
National Survey of Children's Health9 |
||
| 22 - Percentage of children and adolescents aged 1-17 years who had one or more preventive dental care visits in the past year |
The number of children and adolescents, aged 1 through 17 years, who had a preventive dental visit in the past year per 100 children and adolescents aged 1 through 17 years.
Note: Previous iterations of the dashboard had presented data as single-year estimates. Beginning with the 2022 dashboard update, data will be presented as two-year estimates, in accordance with the Health Resources and Services Administration's Federally Available Data (FAD) Resource Document. |
National Survey of Children's Health9 |
||
| 23 - Percentage of NYS residents served by community water systems that have optimally fluoridated water County Dashboard Number - 11 |
The number of residents served by community water systems with optimal fluoride levels per 100 residents served by community water systems. The Safe Drinking Water Information System (SDWIS) contains information about public water systems (PWSs) as reported to EPA by the states. This information is used by regulatory agencies to help track PWS treatment processes, facility data, and compliance with drinking water requirements. | State: Safe Drinking Water Information System (SDWIS)10 County: Safe Drinking Water Information System (SDWIS)10 |
||
| 24 - Percentage of children and adolescents aged 1-17 years who have decayed teeth or cavities in the past 12 months |
The number of children and adolescents, aged 1 through 17 years, who have decayed teeth or cavities in the past 12 months per 100 children and adolescents aged 1 through 17 years.
Note: Previous iterations of the dashboard had presented data as single-year estimates. Beginning with the 2022 dashboard update, data will be presented as two-year estimates, in accordance with the Health Resources and Services Administration's Federally Available Data (FAD) Resource Document. |
National Survey of Children's Health9 |
||
| 25 - Percentage of children aged 6-11 years who were reported by their parents to be physically active at least 60 minutes per day in the past week |
The number of children, aged 6 through 11 years, who were reported by their parents to be physically active at least 60 minutes per day in the past week per 100 children aged 6 through 11 years.
Note: Previous iterations of the dashboard had presented data as single-year estimates. Beginning with the 2022 dashboard update, data will be presented as two-year estimates, in accordance with the Health Resources and Services Administration's Federally Available Data (FAD) Resource Document. |
National Survey of Children's Health9 |
||
| 26 - Child mortality rate per 100,000 children aged 1-9 years County Dashboard Number - 12 |
The number of deaths among children, aged 1 through 9 years, per 100,000 children aged 1 through 9 years. Estimates for the state total on the state level dashboard are provided by the Health Resources and Services Administration, a federal agency, and may be different from state totals on county dashboards that are generated by the NYS specific data sources. |
State: National Vital Statistics System (NVSS)4 County: NYS Vital Statistics Event Registry5 |
||
| 27 - Percentage of children aged 2-4 years who are obese (sex-specific BMI-for-age 95th percentile or higher) in WIC |
The number of children, aged 2 through 4 years, whose measured weight and measured height meet sex-specific, BMI-for-age percentile definitions for obesity per 100 children aged 2 through 4 years, in the Women, Infants, and Children (WIC) program. Estimates for the state total on the state level dashboard are provided by the Health Resources and Services Administration, a federal agency, and may be different from state totals on county dashboards that are generated by the NYS specific data sources. |
Special Supplemental Nutrition Program for Women, Infants, and Children (WIC)11 |
||
| 28 - Percentage of children and adolescents aged 10-17 years who are obese (BMI at or above the 95th percentile) |
The number of children and adolescents, aged 10 through 17 years, who are obese (BMI at or above the 95th percentile) per 100 children and adolescents aged 10 through 17 years.
Note: Previous iterations of the dashboard had presented data as single-year estimates. Beginning with the 2022 dashboard update, data will be presented as two-year estimates, in accordance with the Health Resources and Services Administration's Federally Available Data (FAD) Resource Document. |
National Survey of Children's Health9 |
||
| 29 - Percentage of children and adolescents aged 0-17 years who live in a supportive neighborhood |
The number of children and adolescents, aged 0 through 17 years, who live in a supportive neighborhood (whose parents definitely agree to at least one of the following items and somewhat agree or definitely agree to the other two items: people in the neighborhood help each other out, watch out for each other's children, and know where to go for help in their community) per 100 children and adolescents aged 0 through 17 years.
Note: Previous iterations of the dashboard had presented data as single-year estimates. Beginning with the 2022 dashboard update, data will be presented as two-year estimates, in accordance with the Health Resources and Services Administration's Federally Available Data (FAD) Resource Document. |
National Survey of Children's Health9 |
||
| 30 - Percentage of children and adolescents aged 0-17 years who live in a safe neighborhood |
The number of children and adolescents, aged 0 through 17 years, who live in a safe neighborhood (whose parents definitely agree that their children are safe in their neighborhood) per 100 children and adolescents aged 0 through 17 years.
Note: Previous iterations of the dashboard had presented data as single-year estimates. Beginning with the 2022 dashboard update, data will be presented as two-year estimates, in accordance with the Health Resources and Services Administration's Federally Available Data (FAD) Resource Document. |
National Survey of Children's Health9 |
||
| Children with Special Health Care Needs | ||||
| Indicator | Indicator Description and Note | Data Source | ||
| 31 - Percentage of children and adolescents with special health care needs aged 0-17 years receiving care in a well-functioning system |
The number of children and adolescents with special health care needs (CSHCN), aged 0 through 17 years, who received all components of a well-functioning system (family partnership, medical home, early screening, adequate insurance, easy access to services, and preparation for adult transition) per 100 CSHCN aged 0 through 17 years.
Note: Previous iterations of the dashboard had presented data as single-year estimates. Beginning with the 2022 dashboard update, data will be presented as two-year estimates, in accordance with the Health Resources and Services Administration's Federally Available Data (FAD) Resource Document. |
National Survey of Children's Health9 |
||
| 32 - Percent of families participating in the Early Intervention Program, Part C, who report that early intervention services have helped the family know their rights County Dashboard Number - 13 |
Families exiting the Early Intervention Program, Part C, who completed the Family Outcomes Survey, which is composed of 22 items based on the Impact on Family Scale. The percentage of positive responses was calculated by dividing the total number of positive responses (agreed, strongly agreed or very strongly agreed) by the total number of positive and negative responses (disagree, strongly disagree, very strongly disagree).
Note: Previously, the indicator on the state level dashboard was "Percentage of families participating in the Early Intervention Program (EIP) who meet or exceed the State's standard (person mean>=576) on the New York Impact on Family Scale". The definition changed with the 2018-2019 estimate, leading to a revision of the MCH 2020 objective and baseline year. The new methodology was applied to data from previous years to make them comparable. |
State: NYS Early Intervention Program Family Outcomes Survey12 County: NYS Early Intervention Program Family Outcomes Survey12 |
||
| 33 - Percent of families participating in the Early Intervention Program, Part C, who report that early intervention services have helped the family effectively communicate their children's needs County Dashboard Number - 14 |
Families exiting the Early Intervention Program, Part C, who completed the Family Outcomes Survey, which is composed of 22 items based on the Impact on Family Scale. The percentage of positive responses was calculated by dividing the total number of positive responses (agreed, strongly agreed or very strongly agreed) by the total number of positive and negative responses (disagree, strongly disagree, very strongly disagree).
Note: Previously, the indicator on the state level dashboard was "Percentage of families participating in the Early Intervention Program (EIP) who meet or exceed the State's standard (person mean>=576) on the New York Impact on Family Scale". The definition changed with the 2018-2019 estimate, leading to a revision of the MCH 2020 objective and baseline year. The new methodology was applied to data from previous years to make them comparable. |
State: NYS Early Intervention Program Family Outcomes Survey12 County: NYS Early Intervention Program Family Outcomes Survey12 |
||
| 34 - Percent of families participating in the Early Intervention Program, Part C, who report that early intervention services have helped the family help their children develop and learn County Dashboard Number - 15 |
Families exiting the Early Intervention Program, Part C, who completed the Family Outcomes Survey, which is composed of 22 items based on the Impact on Family Scale. The percentage of positive responses was calculated by dividing the total number of positive responses (agreed, strongly agreed or very strongly agreed) by the total number of positive and negative responses (disagree, strongly disagree, very strongly disagree).
Note: Previously, the indicator on the state level dashboard was "Percentage of families participating in the Early Intervention Program (EIP) who meet or exceed the State's standard (person mean>=576) on the New York Impact on Family Scale". The definition changed with the 2018-2019 estimate, leading to a revision of the MCH 2020 objective and baseline year. The new methodology was applied to data from previous years to make them comparable. |
State: NYS Early Intervention Program Family Outcomes Survey12 County: NYS Early Intervention Program Family Outcomes Survey12 |
||
| 35 - Percentage of adolescents with special health care needs aged 12-17 years who received services needed for transition to adult health care |
The number of adolescents with special health care needs, aged 12 through 17 years, whose families report that they received the services necessary to transition to adult health care per 100 adolescents aged 12 through 17 years.
Note: Previous iterations of the dashboard had presented data as single-year estimates. Beginning with the 2022 dashboard update, data will be presented as two-year estimates, in accordance with the Health Resources and Services Administration's Federally Available Data (FAD) Resource Document. |
National Survey of Children's Health9 |
||
| 36 - Percentage of infants who received a diagnostic hearing test after failing their most recent hearing screening |
The number of infants who received a diagnostic hearing test that is documented in the New York Early Hearing Detection and Intervention Information System (NYEHDI-IS) per 100 infants whose most recent newborn hearing screening results were abnormal. | Early Hearing Detection and Intervention (EHDI) Program13 |
||
| 37 - Percentage of children aged 3-17 years who currently have Autism or Autism Spectrum Disorder |
The number of children, aged 3 through 17 years, reported by their parents to currently have Autism or Autism Spectrum Disorder per 100 children aged 3 through 17 years.
Note: Previous iterations of the dashboard had presented data as single-year estimates. Beginning with the 2022 dashboard update, data will be presented as two-year estimates, in accordance with the Health Resources and Services Administration's Federally Available Data (FAD) Resource Document. |
National Survey of Children's Health9 |
||
| 38 - Percentage of children and adolescents aged 3-17 years with a mental/behavioral condition who received treatment or counseling from a mental health professional during the past 12 months |
The number of children and adolescents, aged 3 through 17 years, with a mental/behavioral condition who received treatment or counseling from a mental health professional during the past 12 months per 100 children and adolescents, aged 3 through 17 years with a mental/behavioral condition.
Note: Previous iterations of the dashboard had presented data as single-year estimates. Beginning with the 2022 dashboard update, data will be presented as two-year estimates, in accordance with the Health Resources and Services Administration's Federally Available Data (FAD) Resource Document. |
National Survey of Children's Health9 |
||
| Adolescent Health | ||||
| Indicator | Indicator Description and Note | Data Source | ||
| 39 - Percentage of adolescents aged 12-17 years with a preventive medical visit in the past year |
The number of adolescents, aged 12 through 17 years, who had one or more preventive medical visits in the past year per 100 adolescents aged 12 through 17 years.
Note: This measure was affected by a 2018 wording change to a question on the National Survey of Children's Health (NSCH). In 2019, the NSCH question was reverted to the original wording. Due to the change, 2018 data were not provided. Single-year estimates for 2017 were also not provided. |
National Survey of Children's Health9 |
||
| 40 - Percentage of adolescents in grades 9-12 who felt sad or hopeless for two or more weeks in a row in the past year |
The number of adolescents in grades 9 through 12 who felt sad or hopeless almost every day for 2 or more weeks in a row so that they stopped doing some usual activities during the 12 months before the survey per 100 adolescents in grades 9 through 12. | Youth Risk Behavior Surveillance System14 |
||
| 41 - Percentage of adolescents aged 12-17 years who were physically active at least 60 minutes per day in the past week |
The number of adolescents, aged 12 through 17 years, who were reported by their parents to be physically active at least 60 minutes per day in the past week per 100 children and adolescents aged 12 through 17 years.
Note: Previous iterations of the dashboard had presented data as single-year estimates. Beginning with the 2022 dashboard update, data will be presented as two-year estimates, in accordance with the Health Resources and Services Administration's Federally Available Data (FAD) Resource Document. |
National Survey of Children's Health9 |
||
| 42 - Child and adolescent mortality, rate per 100,000 population aged 10-19 years County Dashboard Number - 16 |
The number of deaths among children and adolescents, aged 10 through 19 years, per 100,000 children and adolescents aged 10 through 19 years. Estimates for the state total on the state level dashboard are provided by the Health Resources and Services Administration, a federal agency, and may be different from state totals on county dashboards that are generated by the NYS specific data sources. |
State: National Vital Statistics System (NVSS)4 County: NYS Vital Statistics Event Registry5 |
||
| 43 - Suicide mortality among youth, rate per 100,000 population aged 15-19 years County Dashboard Number - 17 |
The number of deaths with an ICD-10 underlying cause of death code: X60-X84 or Y87.0, or U03 per 100,000 adolescents aged 15 through 19 years. Estimates for the state total on the state level dashboard are provided by the Health Resources and Services Administration, a federal agency, and may be different from state totals on county dashboards that are generated by the NYS specific data sources. |
State: National Vital Statistics System (NVSS)4 County: NYS Vital Statistics Event Registry5 |
||
| 44 - Percentage of adolescents in grades 9-12 who are obese (BMI at or above the 95th percentile) |
The number of adolescents in grades, 9 through 12, who are obese (BMI at or above the 95th percentile) per 100 adolescents in grades 9 through 12. | Youth Risk Behavior Surveillance System14 |
||
| 45 - Percentage of children and adolescents aged 3-17 years with a mental/behavioral condition who received treatment or counseling from a mental health professional during the past 12 months |
The number of children and adolescents, aged 3 through 17 years, with a mental/behavioral condition who received treatment or counseling from a mental health professional during the past 12 months per 100 children and adolescents, aged 3 through 17 years with a mental/behavioral condition.
Note: Previous iterations of the dashboard had presented data as single-year estimates. Beginning with the 2022 dashboard update, data will be presented as two-year estimates, in accordance with the Health Resources and Services Administration's Federally Available Data (FAD) Resource Document. |
National Survey of Children's Health9 |
||
| 46 - Percentage of children and adolescents aged 1-17 years who had one or more preventive dental care visits in the past year |
The number of children and adolescents, aged 1 through 17 years, who had a preventive dental visit in the past year per 100 children and adolescents aged 1 through 17 years.
Note: Previous iterations of the dashboard had presented data as single-year estimates. Beginning with the 2022 dashboard update, data will be presented as two-year estimates, in accordance with the Health Resources and Services Administration's Federally Available Data (FAD) Resource Document. |
National Survey of Children's Health9 |
||
| 47 - Percentage of NYS residents served by community water systems that have optimally fluoridated water County Dashboard Number - 18 |
The number of residents served by community water systems with optimal fluoride levels per 100 residents served by community water systems. The Safe Drinking Water Information System (SDWIS) contains information about public water systems (PWSs) as reported to EPA by the states. This information is used by regulatory agencies to help track PWS treatment processes, facility data, and compliance with drinking water requirements. | State: Safe Drinking Water Information System (SDWIS)10 County: Safe Drinking Water Information System (SDWIS)10 |
||
| 48 - Percentage of children and adolescents aged 1-17 years who have decayed teeth or cavities in the past 12 months |
The number of children and adolescents, aged 1 through 17 years, who have decayed teeth or cavities in the past 12 months per 100 children and adolescents aged 1 through 17 years.
Note: Previous iterations of the dashboard had presented data as single-year estimates. Beginning with the 2022 dashboard update, data will be presented as two-year estimates, in accordance with the Health Resources and Services Administration's Federally Available Data (FAD) Resource Document. |
National Survey of Children's Health9 |
||
| 49 - Percentage of children and adolescents aged 10-17 years who are obese (BMI at or above the 95th percentile) |
The number of children and adolescents, aged 10 through 17 years, who are obese (BMI at or above the 95th percentile) per 100 adolescents aged 10 through 17 years.
Note: Previous iterations of the dashboard had presented data as single-year estimates. Beginning with the 2022 dashboard update, data will be presented as two-year estimates, in accordance with the Health Resources and Services Administration's Federally Available Data (FAD) Resource Document. |
National Survey of Children's Health9 |
||
| 50 - Percentage of adolescents without special health care needs aged 12-17 years who received services needed for transition to adult health care |
The number of adolescents without special health care needs, aged 12 through 17 years, whose families report that they received the services necessary to transition to adult health care per 100 adolescents aged 12 through 17 years.
Note: Previous iterations of the dashboard had presented data as single-year estimates. Beginning with the 2022 dashboard update, data will be presented as two-year estimates, in accordance with the Health Resources and Services Administration's Federally Available Data (FAD) Resource Document. |
National Survey of Children's Health9 |
||
| 51 - Percentage of children and adolescents aged 0-17 years who live in a supportive neighborhood |
The number of children and adolescents, aged 0 through 17 years, who live in a supportive neighborhood (whose parents definitely agree to at least one of the following items and somewhat agree or definitely agree to the other two items: people in the neighborhood help each other out, watch out for each other's children, and know where to go for help in their community) per 100 children and adolescents aged 0 through 17 years.
Note: Previous iterations of the dashboard had presented data as single-year estimates. Beginning with the 2022 dashboard update, data will be presented as two-year estimates, in accordance with the Health Resources and Services Administration's Federally Available Data (FAD) Resource Document. |
National Survey of Children's Health9 |
||
| 52 - Percentage of children and adolescents aged 0-17 years who live in a safe neighborhood |
The number of children and adolescents, aged 0 through 17 years, who live in a safe neighborhood (whose parents definitely agree that their children are safe in their neighborhood) per 100 children and adolescents aged 0 through 17 years.
Note: Previous iterations of the dashboard had presented data as single-year estimates. Beginning with the 2022 dashboard update, data will be presented as two-year estimates, in accordance with the Health Resources and Services Administration's Federally Available Data (FAD) Resource Document. |
National Survey of Children's Health9 |
||
-
1 Behavioral Risk Factor Surveillance System (CDC)
- The BRFSS is an annual statewide random telephone (landline and cellphone) surveillance survey designed by the Centers for Disease Control and Prevention (CDC). The survey is conducted in all 50 states and in all US territories. BRFSS monitors modifiable risk behaviors and other factors contributing to the leading causes of morbidity and mortality in the population.
- The state level data for these indicators on the MCH dashboard from the BRFSS (CDC) are provided in a Federally Available Data (FAD) Resource Document, from the Health Resources and Services Administration (HRSA). HRSA obtains the data from BRFSS.
- 2 Behavioral Risk Factor Surveillance System (NYS) County level data. The Expanded BRFSS (EBRFSS) augments the annual CDC Behavioral Risk Factor Surveillance System Survey (BRFSS). The goal of the Expanded BRFSS is to collect county-specific data on preventative health practices, risk factors, injuries and preventable chronic and infectious diseases. County level data are currently available for 2002-03, 2008-09, 2013-14, 2016 and 2018. The New York State BRFSS website has further information.
- 3 New York State (NYS) Pregnancy Risk Assessment Monitoring System (PRAMS)
- New York State PRAMS is an ongoing mail/telephone survey of mothers who have recently given birth to a live born infant. PRAMS collects information from mothers about behaviors and experiences before, during and after pregnancy to improve the health of mothers and infants by reducing adverse outcomes such as low birth weight, infant mortality and morbidity, and maternal mortality and morbidity.
- 4 National Vital Statistics System (NVSS)
- The NVSS provides vital statistics data-births, deaths, marriages, divorces, and fetal deaths-through contracts between the National Center for Health Statistics and vital registration systems operated in jurisdictions responsible for the registration of vital events. The state level data for indicators on the MCH dashboard from NVSS are provided in a Federally Available Data (FAD) Resource Document, from the Health Resources and Services Administration (HRSA). HRSA obtains the data from NVSS.
- 5 Vital Records (Vital Statistics)
- Vital Event Registration:
New York State consists of two registration areas, New York City and New York State Exclusive of New York City (also referred to as Rest of State). New York City (NYC) includes the five counties of Bronx, Kings (Brooklyn), New York (Manhattan), Queens and Richmond (Staten Island); the remaining 57 counties comprise New York State Exclusive of New York City. The Bureau of Vital Records, New York State Department of Health (NYSDOH), processes data from live birth, death, fetal death and marriage certificates recorded in New York State Exclusive of New York City. Through a cooperative agreement, the New York State Department of Health receives data on live births, deaths, fetal deaths and marriages recorded in New York City from the New York City Department of Health and Mental Hygiene (NYCDOHMH). The New York State Department of Health also receives data, from other states and Canada, on live births and deaths recorded outside of New York State to residents of New York State.
Vital Event indicators for NYC geographical areas reported by NYSDOH and NYCDOHMH may be different since the former may include all NYC residents' events regardless of where they occurred and the latter reports only events to NYC residents that occurred in NYC. The indicators may also differ due to timing and/or completeness of data.
The counts of births and deaths may be influenced by specific reporting issues each year. The specific issues are reported in the NYSDOH Annual Vital Statistics Tables, in the Report Measures section of the Technical Notes.
All the vital statistics presented in this report are based on the county/borough of residence.
- 6 Healthcare Cost and Utilization Project-State Inpatient Database (HCUP-SID)
- The Healthcare Cost and Utilization Project (HCUP, pronounced "H-Cup") is a family of healthcare databases developed through a Federal-State-Industry partnership and sponsored by the Agency for Healthcare Research and Quality (AHRQ). HCUP databases bring together the data collection efforts of State data organizations, hospital associations, private data organizations, and the Federal government to create a national information resource of encounter-level healthcare data. The State Inpatient Databases (SID) are State-specific files that contain all inpatient care records in participating states. Together, the SID encompass more than 95 percent of all U.S. hospital discharges. The uniform format of the SID helps facilitate cross-state comparisons.
- The state level data for the indicator on the MCH dashboard from HCUP-SID are provided in a Federally Available Data (FAD) Resource Document, from the Health Resources and Services Administration (HRSA). HRSA obtains the data from HCUP-SID.
- 7 Statewide Planning and Research Cooperative System (SPARCS)
- Information about hospitalizations is collected through the hospital inpatient discharge data system. Each hospitalization receives an ICD-10-CM code at discharge that indicates the primary reason for the hospitalization. There are also up to 24 other diagnosis codes recorded to further describe the hospitalization. Statistics presented in these tables are based on the primary diagnosis unless otherwise noted. This data system does not include information about events that did not result in a hospitalization, such as cases that were only treated in a hospital emergency room. Numbers and rates are based on the number of hospitalizations that occurred and not the number of individuals who were hospitalized. SPARCS measures provided are generated based on patient residence county at time of discharge. If county is not known, county is assigned based on ZIP Code.
- 8 Centers for Medicare and Medicaid (CMS) Hospital Compare
- The CMS Hospital Care Compare provides information on the quality of care that hospitals provide to help consumers make informed decisions about health care. Hospital Care Compare provides data on over 4,000 Medicare-certified hospitals, including acute care hospitals, critical access hospitals (CAHs), children's hospitals, Veterans Health Administration (VHA) Medical Centers, Department of Defense (DoD) and hospital outpatient departments (Hospital Downloadable Database Data Dictionary, CMS, https://data.cms.gov/provider-data/topics/hospitals).
- The state level data for the indicator on the MCH dashboard from CMS are provided in a Federally Available Data (FAD) Resource Document, from the Health Resources and Services Administration (HRSA). HRSA obtains the data from CMS.
- 9 National Survey of Children's Health (NSCH)
- The NSCH provides data on multiple aspects of children's lives-including physical and mental health, access to quality health care, and the child's family, neighborhood, school, and social context. The survey is funded and directed by the Health Resources and Services Administration (HRSA) Maternal and Child Health Bureau (MCHB).
- The state level data for the indicators on the MCH dashboard from NSCH are provided in a Federally Available Data (FAD) Resource Document from HRSA. HRSA obtains the data from NSCH.
- Note: Two NSCH indicators on the MCH dashboard not provided in FAD are directly taken from the National Survey of Children's Health: #29 and #49 Percentage of children and adolescents who live in a supportive neighborhood, and #30 and #50 Percentage of children and adolescents who live in a safe neighborhood.
- 10 Safe Drinking Water Information System (SDWIS)
- The SDWIS is an EPA-maintained database about public water systems across the US and violations and enforcement of drinking water regulations under the Safe Drinking Water Act (SDWA).
- 11 Special Supplemental Nutrition Program for Women, Infants, and Children (WIC)
- The Special Supplemental Nutrition Program for Women, Infants, and Children (WIC) provides federal grants to states for supplemental foods, health care referrals, and nutrition education for low-income pregnant, breastfeeding, and non-breastfeeding postpartum women, and to infants and children up to age five who are found to be at nutritional risk.
- The state level data for the indicator on the MCH dashboard from WIC are provided in a Federally Available Data (FAD) Resource Document, from the Health Resources and Services Administration (HRSA). HRSA obtains the data from WIC.
- 12 New York State Early Intervention Program (EIP) Family Outcome Survey
- The New York State EIP Family Outcomes Survey collects information about the ways in which the EIP helps families of children receiving early intervention services. The New York State EIP is part of the national EIP, a program that identifies and evaluates, as early as possible, infants and toddlers whose healthy development is compromised and provides for appropriate intervention to improve child and family development.
- 13 Early Hearing Detection and Intervention (EHDI) Program
- The New York State EHDI program supports the US Surgeon General's Healthy People 2020 goal ENT-VSL-1 to increase the proportion of newborns who are screened for hearing loss by no later than age 1 month, have audiologic evaluation by age 3 months, and are enrolled in appropriate intervention services no later than age 6 months. If a hearing loss is detected after screenings and assessment, the infant is referred to the NYS Early Intervention Program (EIP) for appropriate intervention services.
- 14 Youth Risk Behavior Surveillance System (YRBSS)
- The YRBSS is a national survey of youth and young adults in the US. It was developed to monitor priority health risk behaviors that are often established in childhood and adolescence. The YRBSS has been conducted every two years since 1991 and surveys high school students on substance use, physical activity, obesity, asthma, dietary behaviors, sexual behaviors, behaviors related to injuries and violence, and other health-related behaviors. The national survey is conducted by CDC and the state, territorial, and tribal governments; and local surveys are conducted by state, territorial, and local education and health agencies and tribal governments.
Index
- Types of Estimates
- Unstable Estimates
- Direction of Indicator Estimates
- Grouping County Estimates into Three Categories
- Comparing the Maternal and Child Health Estimates with the Maternal and Child Health Objectives
- Assessing the Indicator Performance
- Data Filters
- Data Suppression for Confidentiality
- Limitations/Cautions
- References
Types of Estimates
- Percentage: Percentages are calculated per 100 population (births, deaths, families). For example, the number of births (excluding births without a known prenatal care start date) that began prenatal care within the first three months of pregnancy (1st trimester) per 100 live births.
- Weighted percentage: Weighted percentages are generated when presenting results from
survey data (for example, Behavioral Risk Factor Surveillance System (BRFSS), Youth Risk Behavior Surveillance Survey (YRBSS),
National Child Health Survey (NCHS)) which ensures that the data are as representative of New York's population as possible.
Weighted estimates are shown as a percentage (%) and corresponding 95% confidence intervals (CI) are presented when available.
- Rate: A rate is a measure of the frequency with which an event occurs in a defined
population over a specified period of time. Rates used for the Maternal and Child Health tracking measures are
per 1,000, 10,000 or 100,000 population (births, deaths, hospitalizations).
Unstable Estimates
Multiple years of data were combined to generate more stable estimates when the number of events for an indicator
was small (i.e., rare conditions).
The relative standard error (RSE) is a tool for assessing reliability of an estimate. A large RSE is produced when
estimates are calculated based on a small number of cases.1 Estimates with large
RSEs are considered less reliable than estimates with small RSEs. The
National Center for Health Statistics recommends that estimates with RSEs greater than 30% should be considered
unreliable/unstable.2
The RSE is calculated by dividing the standard error of the estimate by the estimate itself, then multiplying that result by 100. The RSE is expressed as a percent of the estimate.
For the Maternal and Child Health dashboard, an asterisk (*) symbol is used to indicate that a percentage or rate is unreliable/unstable. This usually occurs when there are fewer than 10 events in the numerator (RSE is greater than 30%).
Direction of Indicator Estimates
Maternal and Child Health tracking indicators fall into two categories regarding the direction of their estimates. Sometimes lower estimates are better (e.g., child and adolescent mortality rate ages 10-19 years per 100,000 population) and in other cases higher estimates are better (e.g., the percentage of births with early (1st trimester) prenatal care).
This direction of the Maternal and Child Health tracking measure is important to note because the county bar chart, map, and dial use color categories that are based on the direction of the Maternal and Child Health tracking measure. The measure performance is also based on the direction of the Maternal and Child Health tracking indicator.
Some indicators are tracked, but there is no desired direction (e.g., percentage of children aged 3-17 years who currently have Autism or Autism Spectrum Disorder). For these indicators, "Increased" or "Decreased" is used instead to indicate change from the previous data period.
Grouping County Estimates into Three Categories for the County Dial, County Maps, and County Bar Charts
Color Categories Defined
For each Maternal and Child Health tracking indicator, dials, maps, and bar charts are generated when there are enough counties with data different from each other so that dials, maps, and charts can show meaningful differences among the counties. In particular, dials, maps, and charts are not generated if 46 or more counties have rates that are equal to 0 or are missing, or if more than half the counties have the same rate. Dials, maps, and charts are generated all other times. Tables are generated for all indicators in all counties, regardless of rate values.
When dials, maps, and charts are generated, county estimates are grouped into three categories: yellow, green, and blue. These categories are displayed consistently in the county dial, the bar chart, and the New York State map for each tracking indicator.
The three colors represent the quartile distribution of estimates for the counties ordered from those doing the best to those doing the worst.
For Maternal and Child Health tracking indicators where lower estimates are better (e.g., child and adolescent mortality rate ages 10-19 years per 100,000 population):
- The LIGHT GREEN category includes counties which are performing the best (i.e., 50% of counties with the lowest estimates; those in quartile 1 and quartile 2) and is the most favorable category for a county's estimate to be in.
- The DARK BLUE category includes counties which are performing the worst (i.e., 25% of counties with the highest estimates; those in quartile 4) and is the least favorable category for a county's estimate to be in.
- The BLUE-GREEN category includes counties which are performing in the middle (i.e., 25% of counties or those in quartile 3).
For Maternal and Child Health tracking indicators where higher estimates are better (e.g., the percentage of births with early (1st trimester) prenatal care):
- The LIGHT GREEN category includes counties which are performing the best (i.e., 50% of counties with the highest estimates; those in quartile 3 and quartile 4) and is the most favorable category for a county's estimate to be in.
- The DARK BLUE category includes counties which are performing the worst (i.e., 25% of counties with the lowest estimates; those in quartile 1) and is the least favorable category for a county's estimate to be in.
- The BLUE-GREEN category includes counties which are performing in the middle (i.e., 25% of counties or those with estimates in quartile 2).
Length of Color Categories in the County Dial
The length of each color in the county dial represents the minimum and maximum values or cut-off points for the three categories. If the blue area is very big, this indicates that the range of county estimates is large; while a small area indicates a small range of county estimates.
For example, a county dial for one indicator shows a very large dark blue area which ranges from 24.8-57.1; while the blue-green area ranges from 16.8-<24.8
and has a narrower width; similarly, the light green area has a narrow range of estimates from 0.0-<16.8.
Color Switch in County Dial Based on Direction of Indicator Estimates
For Maternal and Child Health tracking indicators where lower estimates are better (e.g., infant
mortality rate per 1,000 live births), the dark blue category is displayed on the right side of the
dial.
For Maternal and Child Health tracking indicators where higher estimates are better (e.g., the percentage
of births with early (1st trimester) prenatal care), the dark blue category is displayed on the left side
of the dial.
Comparing the Maternal and Child Health Estimates with the Maternal and Child Health Objectives
A green color in bar charts or for a number displayed in a data table indicates that the current value for the Maternal and Child Health tracking indicator met the Maternal and Child Health 2020 Objective. A red color in bar charts or for a number displayed in a data table indicates that the current value for the Maternal and Child Health tracking indicator did not meet the Maternal and Child Health 2020 Objective.
Assessing the Indicator Performance
Three different methods were used to assess indicator performance.
- Conduct one-sided z-test to assess the change (increase/decrease or improve/worsen) in estimates between the two most recent time periods.3 The p-value for rejecting the null hypothesis is less than or equal to 0.05 and the critical value for the one-sided test (p-value at 0.05) is 1.645.
- A comparison of confidence intervals of estimates for the two most recent time periods was performed
where this method was more appropriate. A confidence interval is a range around an estimate
that conveys how precise the estimate is. Differences between estimates are considered "statistically significant" when the estimates
being compared do not have overlapping confidence intervals. For the purposes of this dashboard, in cases where the confidence intervals
overlap, the difference is interpreted as not statistically significant at the 95% confidence level.
For survey related indicators, estimates and the two-sided 95% confidence intervals were obtained and used.
In some instances for count data (e.g., births, deaths, hospitalizations, and emergency department visits),
we calculated the one-sided 95% confidence intervals for the estimates and used them for comparison to evaluate
the indicator performance.4
NOTE: This method is an approximation of a statistical test and may result in a more conservative finding. In some cases, an appropriate statistical test would indicate a statistically significant difference even though the confidence intervals overlap and falsely imply no significant difference. When two confidence intervals do not overlap, though, a comparable statistical test would always indicate a statistically significant difference.5 - Simple comparison was conducted where the two estimates were directly compared to each other
based on their magnitude. This was performed when there was not a sufficient amount of data to conduct significance
testing; or if confidence intervals could not be calculated; or if there is some overlap of the two time intervals being
compared (e.g., 2014-2016 and 2015-2017 maternal mortality indicators).
The categories for the Indicator Performance are as follows:- Significantly improved
- Significantly worsened
- No significant change
- Improved^
- Worsened^
- Increased^
- Decreased^
- No change^
- Baseline data
The "^" sign indicates that the performance was determined using simple comparison and not statistical tests.
Programs which provide the data also indicate the time period they use as a baseline. Indicator performance is listed as "Baseline data" until updated data are available for assessing indicator performance.
See Table 1 below for statistical significance techniques used for each type of data source to assess the indicator performance.
Use caution when interpreting significance. For more common conditions (i.e., high incidence rates), there is a higher likelihood that a relatively small change could be detected as statistically significant. Conversely, for rare conditions, the likelihood of detecting a statistically significant change is low even for reasonable changes.
Data Filters
Several data filters are available at state and county levels to quickly select measures based on commonly desired criteria such as measure data status as being compared to the Maternal and Child Health 2020 targets or measure performance over time. Multiple filters could be selected simultaneously.
- State data filters: two data filters are available for state level indicators.
- Filter on meeting 2020 objective target: This filter displays indicators where the most recent state level data meet or do not meet the Maternal and Child Health 2020 objectives.
- Filter on indicator performance over time: The performance status for each indicator is generated by comparing state level data for the two most recent time periods. This filter displays indicators based on indicator performance categories selected.
- County data filters: three data filters are available for county level indicators.
- Filter on meeting 2020 objective target: This filter displays indicators where the most recent specific county data meet or do not meet the Maternal and Child Health 2020 objectives.
- Filter on indicator performance over time: The performance status for each indicator is generated by comparing estimates for the two most recent time periods for a specific county. This filter displays indicators based on indicator performance categories selected.
- Filter on county's position of risk: This filter displays indicators based on the relative position represented by the pointer on the County Dial for risk categories selected.
Data Suppression for Confidentiality
Results are not shown (i.e., suppressed) when issues of confidentiality exist. Suppression rules vary depending on the data source and the indicator.
Table 1. Summary of data suppression and statistical evaluation significance for the Maternal and Child Health Indicators by data source
| Data Sources | Suppression Criteria | Statistical Significance Techniques |
|---|---|---|
| Sample Surveys | ||
| BRFSS (NYS) | Unweighted numerator <6 or Unweighted denominator <50 | 95% CI comparison |
| BRFSS (CDC) | Unweighted denominator <30 | 95% CI comparison |
| NSCH | Unweighted denominator <30 | 95% CI comparison |
| YRBSS | Unweighted denominator < 100 | 95% CI comparison |
| NYS PRAMS | Unweighted denominator < 30 | 95% CI comparison |
| Population Count Data | ||
| NYS VS | Denominator population or event <30 | Rate/percentage: one sided chi-square test with p-value <0.05 |
| NYS SPARCS | Numerator between 1 - 5 cases | Rate/percentage: one sided chi-square test with p-value <0.05 |
| HCUP-SID | Numerator <=10 | Rate/percentage: one sided chi-square test with p-value <0.05 |
| NVSS | Numerator <10 | Rate/percentage: one sided chi-square test with p-value <0.05 |
| Special Supplemental Nutrition Program for WIC | Indicator has a denominator <50 | Rate/percentage: one sided chi-square test with p-value <0.05 |
CI: Confidence Interval
BRFSS: Behavioral Risk Factor Surveillance System
SPARCS: Statewide Planning and Research Cooperative System
Vital Statistics: New York State Vital Statistics (NYS VS Event Registry)
YRBSS: Youth Risk Behavioral Surveillance System
PRAMS: Pregnancy Risk Assessment Monitoring System
HRSA provided data6 are from the following sources:
BRFSS (CDC): Behavioral Risk Factor Surveillance System
HCUP-SID: Healthcare Cost and Utilization Project-State Inpatient Database
NSCH:National Survey of Children"s Health
NVSS: National Vital Statistics System (Natality and Death)
WIC: Women, Infants, and Children (Special Supplemental Nutrition Program)
CMS: Centers for Medicare and Medicaid Services
Limitations/Cautions
State estimates for many measures on the state level dashboard are provided by the Health Resources and Services Administration6 (HRSA), a federal agency, while state estimates for these measures on the county level dashboard are generated by the New York State Department of Health (NYSDOH), using NYS specific data sources. Therefore, the values for NYS from state level dashboard and county level dashboard for the same measure may not be completely the same due to the differences in data sources and/or definitions.
Note: The 2018 population estimates are also used to calculate rates for 2019 and 2020.
References
- About Age Adjusted Rates, 95% Confidence Intervals and Unstable Rates. (see: www.health.ny.gov/statistics/cancer/registry/age.htm)
- Klein RJ, Proctor SE, Boudreault MA, Turczyn KM. Healthy People 2010 criteria for data suppression. Statistical Notes, no 24. Hyattsville, Maryland: National Center for Health Statistics. June 2002. (see: www.cdc.gov/nchs/data/statnt/statnt24.pdf)
- Statistical Significance (see: www.health.ny.gov/statistics/chac/chai/docs/statistical_significance.pdf)
- One-sided 95% confidence interval (see: https://www.graphpad.com/guides/prism/6/statistics/one_sided_confidence_intervals.htm)
- Guidelines for using confidence intervals for public health assessment, Washington State Department of Health, (see: www.doh.wa.gov/Portals/1/Documents/1500/ConfIntGuide.pdf)
- Title V Maternal and Child Health (MCH) Services Block Grant Program Resource Page, (see: Guidance and Documents Federally Available Data (FAD) Resource Document.
User's Guide
This is the users guide to the Prevention Agenda dashboard. However, the directions on using the dashboard also apply to the Maternal and Child Health dashboard (except that the MCH dashboard doesn't have a sub-county section).
Other Dashboards and Useful Links
- New York State Prevention Agenda 2019-2024
- Asthma in New York
- Communicable Disease Annual Reports
- Community Health Indicator Reports (CHIRS)
- County Health Indicators by Race/Ethnicity (CHIRE)
- County/ZIP Code Perinatal Data Profile
- Environmental Public Health Tracker
- Expanded Behavioral Risk Factor Surveillance System
- Leading Causes of Death
- Minority Health Data and Statistics
- New York State Cancer Registry
- Opioid-related Data in New York State
- Pregnancy Risk Assessment Monitoring System (PRAMS) Dashboard
- Sexually Transmitted Diseases Data and Statistics
- Vital Statistics
Contact Us
If you have questions about the reports, please contact:
Public Health Information Group at: phiginfo@health.ny.gov